Obama’s Numbers (January 2015 Update)
Jobs, paychecks, corporate profits and stock prices have all improved since our last report on the Obama statistical record. Some highlights:
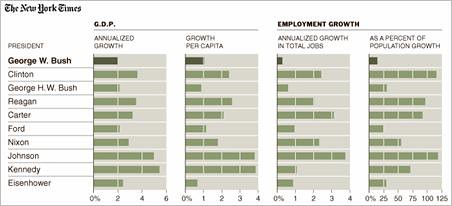
◾The economy has now gained nearly five times more jobs under President Barack Obama than it did during the presidency of George W. Bush, and the unemployment rate has dropped to just below the historical average.
◾Real weekly earnings are up 1.7 percent, thanks in part to a plunge in gasoline prices.
◾Corporate profits have nearly tripled, and stock prices have soared.
◾On the other hand, the number of Americans receiving food stamps remains 45 percent higher than when the president first took office, and the rate of home ownership has dropped by 3.2 percentage points, to the lowest point in nearly 20 years.
◾The average premium for a benchmark “silver” health plan in the Obamacare marketplaces rose only 2 percent this year, and consumers had more plans from which to choose. But the tax penalty for going without insurance will double.
Analysis
As we do every three months, we offer here a fresh update of selected statistical indicators of what has happened since Barack Obama first took the oath of office in January 2009. Some are positive and some are not, but all are from sources we consider solid and reliable. And as usual, we caution that no single number or collection of numbers can tell the entire story.
Jobs & Unemployment
Now that 2014 has gone on the books as the best year for employment growth in 15 years, the official figures show that the U.S. had 6,371,000 more people employed in December than it did when Obama took office in 2009. So during Obama’s first six years in office, the U.S. has added nearly five times more jobs than it did during the entire eight years under President George W. Bush. (Bush’s total was just under 1.3 million.)
Bush’s record suffered from a loss of nearly 4.4 million jobs in the last 12 months of his presidency, and we can’t say what the last two years of Obama’s tenure will bring.
The official unemployment rate has now dipped to 5.6 percent, which is 2.2 percentage points below where it was when Obama first took office. It is not only the lowest jobless rate in six years — it is slightly better than the historical average. Since 1948, the monthly jobless rate has averaged 5.8 percent.
Some scars from the Great Recession of 2007-2009 still linger. There are nearly 2.8 million people suffering from long-term unemployment — being out of work for 27 weeks or longer. That is 86,000 higher than it was when Obama entered office.
And the average number of weeks that the unemployed have been without work was 32.8 weeks — which is 13 weeks longer than the average duration of joblessness for the month Obama entered the White House.
Prices & Wages
Consumer Prices — Overall inflation in consumer prices has remained moderate over Obama’s first six years, rising by only 11.8 percent between January 2009 and November of last year, the most recent month for which the Bureau of Labor Statistics has released the Consumer Price Index.
Gasoline — Lately, the CPI has been held down by a historic drop in fuel prices. Gasoline prices have plunged so steeply since last June that they are nearly as low as when Obama first took office amid a worldwide recession. As of the week ending Jan. 5, the price at the pump of unleaded regular gasoline was down to $2.21 per gallon, according to the U.S. Energy Information Administration. That’s just 20 percent higher than the unusually low point at which it stood on Inauguration Day 2009.
Real Weekly Earnings — With inflation in check, the purchasing power of weekly paychecks has been rising, especially in the last few months. The BLS measure of average weekly earnings for all workers, adjusted for inflation and seasonal factors, was 1.7 percent higher in November (the most recent month available) than it was when Obama first took office. And the figure has gone up 1.4 percent since June, when fuel prices started dropping.
Food Stamps — Despite the improving economy, the number of Americans receiving benefits under the Supplemental Nutrition Assistance Program, formerly known as “food stamps,” has hardly declined at all since our last report. As of September 2014, the most recent month for which the government has released figures, the total stood at just below 46.5 million people, or about 1 out of 9 Americans. The number is only 2.8 percent below the peak reached in December 2012, and still more than 45 percent higher than the month before the president was first sworn in.
Obama’s legacy is almost certain to include a stubbornly large increase in the food stamp rolls. The nonpartisan Congressional Budget Office projects a very slow decline in the rolls. As of its most recent “baseline” projections of the program, CBO estimated that when Obama leaves office in 2017, the number of food stamp beneficiaries will still be at 42.7 million — one third more than when he entered.
Home Ownership — In spite of historically low mortgage rates and an improving economy, the rate of home ownership has slid to its lowest point in nearly 20 years.
As of the third quarter of 2014, the percentage of U.S. householders who owned their own homes was 64.3 percent, according to the most recent figures from the U.S. Census Bureau. That is lower than at any time since the fourth quarter of 1994.
Home ownership peaked at 69.4 percent in early 2004, but it has declined 5.1 percentage points since then. Most of the decline — 3.2 percentage points — has taken place since Obama first took office.
Profits & Markets
Corporate Profits — Profits of business corporations are soaring under Obama, setting new records. In the third quarter of 2014, the most recent period for which figures have been released, after-tax corporate profits were running at a seasonally adjusted annual rate of just under $1.9 trillion, the highest ever recorded.
That figure is 182 percent higher than in the recession-wracked quarter before Obama first took office. It is also 34 percent higher than the pre-recession peak, which was the third quarter of 2006.
Stock Markets — Stockholders continue to do quite well under Obama. The Standard & Poor’s 500-stock index stood at 156 percent higher at the close on Jan. 8 than it did the day Obama took office. Other stock indexes show similarly robust gains. The Dow Jones Industrial Average also has more than doubled, rising 125 percent during Obama’s tenure, and the NASDAQ Composite index is up 229 percent, more than tripling during the same period.
Obamacare
The millions who are renewing their individual market coverage under the Affordable Care Act — or signing up for new coverage — are finding that they have more choices than in 2014, and that the average cost of a policy has risen only modestly.
More insurance companies are competing in the new ACA marketplaces. “There are over 25 percent more issuers participating in the Marketplace in 2015″ than in 2014, according to the most recent official figures from the Department of Health and Human Services.
Meanwhile, the average cost across all U.S. counties for a benchmark (second-lowest-cost) “silver” policy rose only 2 percent, according to the nonpartisan Kaiser Family Foundation. HHS also reported a 2 percent average rise for a benchmark “silver” plan.
The cheaper and less generous “bronze” plans rose an average of 4 percent, KFF said. And it found that premium changes varied widely depending on location, from an increase of 34 percent for a benchmark silver plan in southeastern Alaska, to a whopping 45 percent reduction in Summit County (Breckenridge), Colorado. Also, it will pay for policyholders to shop around: A New York Times analysis of the rate data showed many with existing marketplace plans would see a premium hike (as high as 20 percent) unless they switched policies.
Previously, there were indications the average premium would actually decrease. In our last report, we quoted a preliminary KFF study that showed the average premium had gone down by 0.8 percent. But as we noted at the time, that was based on analysis covering only the largest cities in 15 states and the District of Columbia where information from rate filings was available. KFF later revised the figure when filings from all 50 states and the District of Columbia became available.
The ACA’s second annual open enrollment period began Nov. 15 and will remain open through Feb. 15. So it is still too early to say how many more will sign up for coverage this year, compared with last. So far, enrollment has been brisk, and without the technical foul-ups that plagued the system a year earlier.
There’s solid evidence that the new law has extended health insurance coverage to millions. But how many millions have gained coverage, and how many will remain uninsured, won’t be known for some time. According to the most recent release of the National Health Interview Survey conducted by the Centers for Disease Control and Prevention, the percentage of people without health insurance at the time they were interviewed fell to 12.2 percent of the population during the first six months of 2014, down from 14.4 percent during 2013, before the ACA’s insurance marketplaces took effect (see Table 1).
One thing we can say with certainty is that the law’s basic tax penalty for failing to obtain coverage has doubled for 2015, going from 1 percent of household income for those who were uninsured in 2014 to 2 percent of household income for those who don’t get coverage this year.
The minimum tax penalty, for those with very low income, has more than tripled. It went from $95 per adult for being uninsured in 2014 to $325 for 2015. The penalty amounts have been part of the law since it passed in 2010, and the higher rates went into effect Jan. 1.
Those who were uninsured in 2014 must pay the tax penalty when they file their 2014 income tax returns, which are due by April 15. (The IRS is calling it an “individual shared responsibility payment,” neatly avoiding taking sides on the politicized question of whether it’s a “tax” or a “penalty.”)
Federal Debt
The federal debt has already grown more during Obama’s first six years than under all previous U.S. presidents combined, at least in nominal dollars with no adjustment for inflation. The debt owed to the public stands at about $13 trillion, an increase of 106 percent since Obama first took office.
Total debt, counting money the government owes to itself, stands at $18.1 trillion, up 70 percent.
Both debt figures continue to grow, though less rapidly than during Obama’s first few years when annual deficits topped $1 trillion for four years running. The U.S. finished the most recent fiscal year with a deficit of $483 billion. But the nonpartisan Congressional Budget Office projects that unless Congress acts to trim future spending or raise future taxes, or some combination of both, those annual deficits will soon be rising again. The most recent “baseline” budget projection, which CBO issued in August, forecasts that under current law the deficit will rise above half a trillion in fiscal 2016 and hit $960 billion within a decade.
Energy
U.S. Oil Production — A major cause of the drop in fuel prices is the historic boom in U.S. crude oil production that has continued throughout the Obama years. In the third quarter of last year, the U.S. produced nearly 76 percent more crude oil than it did in the three months before Obama began his presidency.
And with domestic production surging, U.S. reliance on imported oil has been cut in half. Under Obama, as of the July-September quarter of 2014, imports were down 55 percent.
These changes are due mainly to advances in drilling technology rather than to any change in government policy.
Wind & Solar — Electricity generated by wind and solar power in the most recent 12 months on record (ending in October) was 248 percent higher than the total for 2008. That was spurred in part by large federal tax subsidies for wind and solar generation, all supported by Obama. But those increases still left the nation producing just 4.8 percent of all its electricity from wind and solar in the most recent 12 months on record, up from 1.4 percent in 2008. Coal accounted for the biggest share, followed by natural gas and nuclear power.
Unfulfilled Promises
Exports — In January 2010, the president said in his State of the Union address, “We will double our exports over the next five years.” That hasn’t come close to happening.
According to the most recent report of the Bureau of Economic Analysis, U.S. exports of goods and services have gone up by just under 39 percent since Obama took office — and by only 35.1 percent since he uttered the promise.
That’s because many of the United States’ trading partners are struggling economically, leaving them less able to buy what the U.S. would like to export. The average unemployment rate among all 28 European Union countries, for example, was 10 percent in November, according to Eurostat, the union’s statistical office. The U.S. rate was 5.8 percent that month. Also in November, Japan officially entered an economic recession.