1
   

Why the Left Is Furious at Lieberman; Iraq is only a part


nimh
 
  1  
Reply Fri 25 Aug, 2006 12:38 pm
kelticwizard wrote:
There WAS no stock market meltdown in 2000.

Con't you conservatives EVER get your facts straight before posting this dross on message boards? [..]

Here is the Dow Jones under three presidents. You show me the stock market "meltdown of 2000".

Oh Keltic, I'm so feeling you - you are so much like me. Ive tried this so often too.

I went the whole graph route about military budgets, which conservative posters were claiming had been "slashed" under Clinton. I posted the graph, showing that the budget actually remained stable under Clinton - and that was at a multiple the level of what it had been before the Reagan/Bush era, and even as the Cold War and Gulf War that had mushroomed military expenditures in the 80s/early 90s ended.

Their response was that them staying stable really meant they were declining. You know, relatively.

I dont know how it works. I guess its some disconnect that warps the graph even as it is being processed by their vision.

Like:

  • Under Clinton, last two years, stock market stabilised, remaining at the same level == that is a downturn.
  • Under Bush, the subsequent two years, stock market dropped over 20% == that is performing decently.
Also notice something else in that graph. The one thing Bush supporters always say when confronted with numbers on ballooning deficits, unemployment rates, dropping stock market etc is, well there was 9/11. But you can see that after 9/11 the stock market actually recovered quickly. It was only about half a year later that it started steeply dropping for real.
0 Replies
 
okie
 
  1  
Reply Fri 25 Aug, 2006 12:44 pm
Clinton enjoyed a time of reduced military spending, and a couple of good things he did was thrust in his lap by the Republican Congress, reigning in spending, and welfare reform, both of which had the positive effects on the economy. Clinton can have partial credit for the economy, fine and dandy, but I happen to believe the economy has cycles that are sort of beyond the control of presidents. I would liken the economy to an oceanliner. It can be steered, but it has delayed effects and it is gradual. Many of the decisions that affect the economy are made years before the effects are seen.

Well, to clarify, some of the measures that affect the economy are smaller and more immediate, while others are longer term.
0 Replies
 
nimh
 
  1  
Reply Fri 25 Aug, 2006 12:47 pm
okie wrote:
Clinton enjoyed a time of reduced military spending

Ha! That is too funny. You posted right as I was still getting an edit through of my post above. And this is what I was adding to my post above:

nimh wrote:
I went the whole graph route about military budgets, which conservative posters were claiming had been "slashed" under Clinton. I posted the graph, showing that the budget actually remained stable under Clinton - and that was at a multiple the level of what it had been before the Reagan/Bush era, and even as the Cold War and Gulf War that had mushroomed military expenditures in the 80s/early 90s ended.

Their response was that them staying stable really meant they were declining. You know, relatively.
0 Replies
 
okie
 
  1  
Reply Fri 25 Aug, 2006 12:50 pm
Remember the liberal definition of "cuts" nimh. Any reduction in the rate of growth is a draconian "cut."
0 Replies
 
real life
 
  1  
Reply Fri 25 Aug, 2006 12:54 pm
kelticwizard wrote:
real life wrote:
and who also vice-presided over the stock market meltdown of 2000 terming the economy of that day 'the best in the last 50 years'.


There WAS no stock market meltdown in 2000.

Con't you conservatives EVER get your facts straight before posting this dross on message boards? You have had six years to get your story straight, and you haven't manged it yet!

Here is the Dow Jones under three presidents. You show me the stock market "meltdown of 2000".


Take a look at the NASDAQ, which is heavy in the tech sector (the cutting edge of the economy) . It lost 1/2 its value between Jan 2000 and Jan 2001-- before Bush took office. The economy was headed for the tank under the last year of Hilly and Billy Clinton.

Billions of dollars of valuation gone.

Seriously, you didn't know this?
0 Replies
 
nimh
 
  1  
Reply Fri 25 Aug, 2006 12:55 pm
Here's the link, from back then. Some conservative had claimed military budgets under Clinton had been "decimated". Whereas this is the graph; and here's another one.

nimh wrote:
[..] military spending in the US stabilised - at two-three times the level it had been on in the seventies.

During the nuclear arms race in the eighties and then the Gulf War under Bush Sr., expenditure had boomed. When the [..] the Cold War was over and the Gulf War was too, a lot of talk was about the "peace dividend". As you can see, Clinton didn't cash it. Budget reductions were only a fraction of the increases of the 1980s. After 1996 spending increased again in fact. [..]

In fact, [while] world military spending, in 1995-1996, "was down 40% from the 1987 peak level" [..] US military spending, in the same period, was down six percent.
0 Replies
 
kelticwizard
 
  1  
Reply Sat 26 Aug, 2006 12:33 am
kelticwizard wrote:
Here is the Dow Jones under three presidents. You show me the stock market "meltdown of 2000".


real life wrote:
Take a look at the NASDAQ, which is heavy in the tech sector....


And since when are we referring to the NASDAQ when we say "the stock market", as in "stock market crash" or "stock market boom"? For the lifetime of everyone here, "the stock market" has meant the Dow Jones Industrials. You are playing word games here, trying to find some flaw in what was excellent economic performance by Clinton.

Yes, the tech sector did not do well in 2000, which might have been one of the reasons the Dow levelled off in 2000. but levelling off is not a downturn, and it most certainly is not a meltdown. Yet you and Okie are on here insisting it is, despite the overwhelming visual evidence to the contrary.

Anyone who knows anything about stocks also knows this basic theme-in the long run, the stock market makes sense, but in the short run it is subject to fluctuations that really don't. Let's take a look at some of the employment figures in the tech sector which give a far better picture of what is really happening than the short term NASDAQ. These figures are from the NAICS, for full time employees

COMPUTER SYSTEMS-DESIGN AND RELATED SERVICES
(In thousands)

1998: 1,129
1999: 1,211
2000: 1,294
2001: 1,219
2002: 1,080


INFORMATION AND DATA PROCESSING SERVICES
(In thousands)

1998: 469
1999: 504
2000: 538
2001: 504
2002: 455

As you can see, the tech sector was hiring people on in 2000-the exact year you claim that it was crashing. If business was so bad, why would they do that?

Conservatives will fiddle faddle with any sets of numbers they can find to try to pretend the nineties were not good-when in fact they were.
0 Replies
 
kelticwizard
 
  1  
Reply Sat 26 Aug, 2006 12:51 am
okie wrote:
I do think however that there is a minor effect exerted on the stock market that relates to the liberal psyche. Libs are depressed right now, and kind of in the tank, and some don't even invest very aggressively when they are pessimistic. They make up a portion of investors I would consider to be "emotional investors." Most are fairly pragmatic at the end of the day, but compared to conservatives, I think more emotional.......I think the market has an emotional component, and liberals are emotional.


Reading this tripe is like reading one of those web pages which combine scientific analyses gleaned from popular magazines with UFO sightings and spirit contacts. Up to now, I really thought that economic analyis was immune to the aluminum foil hat contingent, but Okie has proven me wrong.

A tip to anyone seeking investment advice: If by chance you run into someone who starts talking about "the liberal psyche" when it comes to your money, close your accounts immediately and run, don't walk, out the door.
0 Replies
 
Thomas
 
  1  
Reply Sat 26 Aug, 2006 01:45 am
okie wrote:
I do think however that there is a minor effect exerted on the stock market that relates to the liberal psyche. Libs are depressed right now, and kind of in the tank, and some don't even invest very aggressively when they are pessimistic. They make up a portion of investors I would consider to be "emotional investors." Most are fairly pragmatic at the end of the day, but compared to conservatives, I think more emotional.......I think the market has an emotional component, and liberals are emotional.

Since you obviously believe what you're saying here, and since you would surely side with the rational, conservative investors -- may I ask what fraction of your savings you have invested in call options or short positions on the Dow? If you are right, such investments are the obvious way of getting rich quick. Specifically, "rich" means multiple times (up to 20 times) your current investment, and "quick" means as soon as the free market catches up with reality again. This shouldn't take longer than a year or two. So how about it? How highly are you invested in call options and long positions these days? If your answer is "not at all", my next question is, why? Don't you want to get rich quick? Or alternatively, don't you really believe what you are saying here?
0 Replies
 
Foxfyre
 
  1  
Reply Sat 26 Aug, 2006 07:30 am
2000 Crash
Introduction:
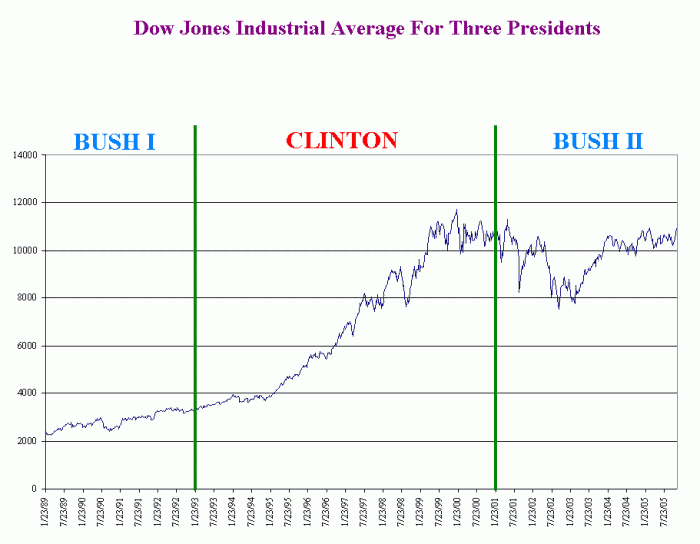
From 1992-2000 the markets and economy had a record period of growth. The IPO market had new companies trading at over a 1 billion dollar market cap, with no profits and less than 1 million dollars in revenue.

The NASDAQ was trading at 4234.33 on September 1, 2000. From Sep 2000 the NASDAQ dropped 45.9% to 2291.86 by Jan 02, 2001. In Oct. of 2002, the NASDAQ dropped as low as 1,108.49 which is a 78.4% drop from its all-time high of 5,132.52 in Mar. of 2000. A sum of 8 trillion dollars of wealth was lost in the market crash.
http://www.stockadvisorgroup.com/Resources/MarketHistory.html


Causes of the Crash:


1. Corporate Corruption

Many companies overstated their profits by means of fraud and accounting loopholes and they hid their debt. Corporate officers had outrageous stock options that diluted the company.

2. Stocks Were Overvalued

Stocks were trading in the hundreds and some in the thousands on a P/E basis. Some companies, which were losing tons of money with no hope of profit for many years, had over a 1 billion dollar market cap.

3. A Wave of New Day traders and Momentum Investors

The arrival of the Internet and online trading provided a fast and inexpensive way to trade the markets. This led to millions of new investors trading the markets with little or no experience.

4. Conflict of Interest by Research Firms

Stock analysts and investment bankers worked very closely together. Whenever a company was trying to raise capital, the investment bankers made sure their research firms would put positive ratings on stocks. This caused companies to have favorable ratings although they were in severe financial trouble. In some cases analysts had favorable ratings on a stock less than a month before the company filed for chapter 11.


Reforms after the Crash


1. New Rules for Day traders. Investors need at least $25,000 in their account in order to actively trade the markets. New restrictions were placed on marketing methods for day trading firms.

2. CEO and CFO accountability for their balance sheets. CEO's and CFO's are now required to sign-off on their statements. Also, the punishment for fraud has been beefed up.

3. Accounting reform. This includes more disclosure of balance sheet info. Things such as stock options and offshore companies are to be disclosed so investors can better judge if the company is really producing a positive cash-flow.

4. Separation of Investment Banking and Analyst Research.

Fines were given to the big firms that were mainly responsible for deceptive practices. There was major reform to ensure divide research from the investment banking business.
0 Replies
 
nimh
 
  1  
Reply Sat 26 Aug, 2006 08:00 am
Foxfyre wrote:
The NASDAQ was trading at 4234.33 on September 1, 2000. From Sep 2000 the NASDAQ dropped 45.9% to 2291.86 by Jan 02, 2001.

As Keltic asked, "since when are we referring to the NASDAQ when we say "the stock market", as in "stock market crash" or "stock market boom"?"

Its a bit weird to claim a "stock market meltdown", and then, when asked for evidence, to reject the actual main, overall Dow Jones stock market index, which didnt even show a downturn let alone a meltdown, and insist to instead only use a more sectoral, specific index. That's so transparently selective that its hard to even take seriously.
0 Replies
 
edgarblythe
 
  1  
Reply Sat 26 Aug, 2006 08:04 am
Dang it, nimh, there you go making sense again.
0 Replies
 
Foxfyre
 
  1  
Reply Sat 26 Aug, 2006 08:06 am
The DJA showed no downturn? Check out this history. Pay particular attention to the roller coaster DJA in 2000 and beyond, especialy after 9/11. It has just now recovered to be close to where it was at its peak in 2000. I know. I have watched our own investments and the severe hit they took for awhile though the recovery, courtesy of Bush administration reforms and policies, has been quite nice.

http://www.mdleasing.com/djia.htm
0 Replies
 
kelticwizard
 
  1  
Reply Sat 26 Aug, 2006 08:56 am
Foxfyre wrote:
The DJA showed no downturn? Check out this history. Pay particular attention to the roller coaster DJA in 2000 and beyond...


http://img.photobucket.com/albums/v645/kelticwizard100/DowJones3Pres.gif

Jeez, Foxfyre, can't you read a graph? I don't see any particular roller coaster during 2000 at all. The market levelled off after growing rapidly, that is all.

I hope the people reading this are paying attention to the descriptions the conservatives are giving a levelling off of the stock market into 2000 after years of wonderful growth.

One called it a "meltdown". The second called it a "downturn". Now Foxfyre calls it a "roller coaster". It's amazing-these people just cannot handle the fact the economy did so well in the nineties.
0 Replies
 
Foxfyre
 
  1  
Reply Sat 26 Aug, 2006 09:06 am
You must not be reading the same graph I'm seeing posted here then. You have to understand that most investors are not long term investors. Those that got in at or near the top of those peaks took huge hits when the average plunged. And those plunges were huge. Sure those who got in decades ago and have ridden the market all the way have done okay. That isn't the case with most investors who got in at the wrong time.
0 Replies
 
kelticwizard
 
  1  
Reply Sat 26 Aug, 2006 09:17 am
Foxfyre, what are you looking at??

We're talking about the year 2000. That year ends with the green line on the right. The Dow is flat, with some short peaks and valleys.

After that, you get Bush Jr.
0 Replies
 
dyslexia
 
  1  
Reply Sat 26 Aug, 2006 09:20 am
foxy, "most" investors are indeed long term investors.
0 Replies
 
Foxfyre
 
  1  
Reply Sat 26 Aug, 2006 09:24 am
KW, from the link I posted earlier:

2000 Jan 07 Rises 269.30 to close at 11,522.56, first close above 11,500.00.
Jan 14, 2000 Rises 140.55 to close at all time high of 11,722.98, first close above 11,600.00 and 11,700.00.
Mar 07, 2000 Falls 60.50 to close at 9,796.03 for a YTD low completing a tumble of 16.48% from Jan 14.
Mar 16, 2000 Rises 499.19 to close at 10,630.39, largest dollar gain in history, up 4.93%.
Apr 14, 2000 Falls 617.78 to close at 10,305.77, second largest dollar loss in history, down 5.66%.
2001 May 21 Rises 36.18 to close at 11,372.92 recovering 1,983.44 (85%) of the 2,333.50 decline since Jan 14, 2000.

This is your idea of flat?
0 Replies
 
kelticwizard
 
  1  
Reply Sat 26 Aug, 2006 10:10 am
Foxfyre, this is ridiculous.

There were a couple of troughs lasting a few weeks, and a peak which lasted a month or so. As you can plainly see, most of the weeks were right in the 10,500 to 11,000 range, or very close to it.

You're trying desperately to find something wrong, and there really wasn't.
0 Replies
 
Cycloptichorn
 
  1  
Reply Sat 26 Aug, 2006 10:27 am
The total slope of a line is determined by averaging the start and endpoints, regardless of fluctuations inbetween.

So, yes, even if it goes up and down in the middle, it is essentially flat. I guess we'll just add this to the list of stuff you don't know a damn thing about.

Cycloptichorn
0 Replies


Related Topics

Obama '08? - Discussion by sozobe
Let's get rid of the Electoral College - Discussion by Robert Gentel
McCain's VP: - Discussion by Cycloptichorn
The 2008 Democrat Convention - Discussion by Lash
McCain is blowing his election chances. - Discussion by McGentrix
Snowdon is a dummy - Discussion by cicerone imposter
Food Stamp Turkeys - Discussion by H2O MAN
TEA PARTY TO AMERICA: NOW WHAT?! - Discussion by farmerman
 
Copyright © 2025 MadLab, LLC :: Terms of Service :: Privacy Policy :: Page generated in 0.03 seconds on 02/06/2025 at 03:01:36