@georgeob1,
Quote georgeob1:
Quote:you will find that real (inflation adjusted) GDP growth rates for the 2009 - 2015 recovery are about 1/3rd less than those of the comparative period for 2001 - 2007. A comparison with earlier recovery periods yields even greater differences.
You like facts? Here are some facts. You mentioned GDP and jobs. Okay.
GDP per capita the quarter before taking office.
George W. Bush
2000 Q3: $44, 586
2000 Q4: $44, 721
Total: +1.2% increase in GDP per capita annualized the quarter before Bush took office.
Barack Obama
2008 Q3: $48,841
2008 Q4: $47,647
Total: -9.1% drop in GDP per capita annualized the quarter before Obama took office.
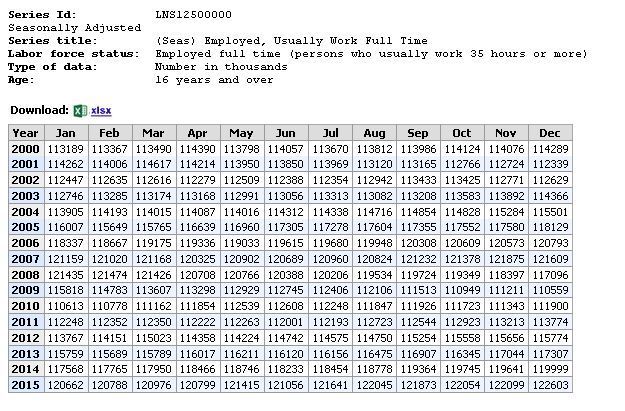
Now let's look at jobs.
Full Time jobs the quarter before taking office.
George W. Bush
2000 Q3: 113.986 Million Full Time jobs
2000 Q4: 114.289 Million Full Time jobs
Total: Plus 0.303 Million Full Time jobs added the quarter before George W. Bush took office.
Barack Obama
2008 Q3: 119.724 Million Full Time jobs
2008 Q4: 117.096 Million Full Time jobs
Total: Minus 2.6 Million Full Time jobs LOST the quarter before Obama takes office.
Check the chart:

As you or anyone can see, your analysis completely ignores the extreme severity of the GDP per capita drop and Full Time jobs hemorrhage that Obama walked into, as opposed to the mild uptick that George W. Bush walked into.
Unless you can find some past recessions that were anywhere near as severe as a 9% loss in GDP per capita or 2.6 Million Full Time jobs lost the quarter before taking office, your assertions make as much sense as a football coach telling a player who wants to leave the game because his lower leg is dangling freely from his knee socket, "The other guys on the team got hurt but they're still out there playing. What's wrong with you, Nancy boy!"