Israel: Dr. Nathan Paldor, Professor of Dynamical Meteorology and Physical Oceanography at the Hebrew University of Jerusalem has authored almost 70 peer-reviewed studies and won several awards. "First, temperature changes, as well as rates of temperature changes (both increase and decrease) of magnitudes similar to that reported by IPCC to have occurred since the Industrial revolution (about 0.8C in 150 years or even 0.4C in the last 35 years) have occurred in Earth's climatic history. There's nothing special about the recent rise!"
Russia: Russian scientist Dr. Oleg Sorochtin of the Institute of Oceanology at the Russian Academy of Sciences has authored more than 300 studies, nine books, and a 2006 paper titled "The Evolution and the Prediction of Global Climate Changes on Earth." "Even if the concentration of ?'greenhouse gases' double man would not perceive the temperature impact," Sorochtin wrote. (Note: Name also sometimes translated to spell Sorokhtin)
Spain: Anton Uriarte, a professor of Physical Geography at the University of the Basque Country in Spain and author of a book on the paleoclimate, rejected man-made climate fears in 2007. "There's no need to be worried. It's very interesting to study [climate change], but there's no need to be worried," Uriate wrote.
Netherlands: Atmospheric scientist Dr. Hendrik Tennekes, a scientific pioneer in the development of numerical weather prediction and former director of research at The Netherlands' Royal National Meteorological Institute, and an internationally recognized expert in atmospheric boundary layer processes, "I find the Doomsday picture Al Gore is painting - a six-meter sea level rise, fifteen times the IPCC number - entirely without merit," Tennekes wrote. "I protest vigorously the idea that the climate reacts like a home heating system to a changed setting of the thermostat: just turn the dial, and the desired temperature will soon be reached."
Brazil: Chief Meteorologist Eugenio Hackbart of the MetSul Meteorologia Weather Center in Sao Leopoldo - Rio Grande do Sul, Brazil declared himself a skeptic. "The media is promoting an unprecedented hyping related to global warming. The media and many scientists are ignoring very important facts that point to a natural variation in the climate system as the cause of the recent global warming," Hackbart wrote on May 30, 2007.
France: Climatologist Dr. Marcel Leroux, former professor at Université Jean Moulin and director of the Laboratory of Climatology, Risks, and Environment in Lyon, is a climate skeptic. Leroux wrote a 2005 book titled Global Warming - Myth or Reality? - The Erring Ways of Climatology. "Day after day, the same mantra - that ?'the Earth is warming up' - is churned out in all its forms. As ?'the ice melts' and ?'sea level rises,' the Apocalypse looms ever nearer! Without realizing it, or perhaps without wishing to, the average citizen in bamboozled, lobotomized, lulled into mindless acceptance. ... Non-believers in the greenhouse scenario are in the position of those long ago who doubted the existence of God ... fortunately for them, the Inquisition is no longer with us!"
Norway: Geologist/Geochemist Dr. Tom V. Segalstad, a professor and head of the Geological Museum at the University of Oslo and formerly an expert reviewer with the UN IPCC: "It is a search for a mythical CO2 sink to explain an immeasurable CO2 lifetime to fit a hypothetical CO2 computer model that purports to show that an impossible amount of fossil fuel burning is heating the atmosphere. It is all a fiction."
Finland: Dr. Boris Winterhalter, retired Senior Marine Researcher of the Geological Survey of Finland and former professor of marine geology at University of Helsinki, criticized the media for what he considered its alarming climate coverage. "The effect of solar winds on cosmic radiation has just recently been established and, furthermore, there seems to be a good correlation between cloudiness and variations in the intensity of cosmic radiation. Here we have a mechanism which is a far better explanation to variations in global climate than the attempts by IPCC to blame it all on anthropogenic input of greenhouse gases."
Germany: Paleoclimate expert Augusto Mangini of the University of Heidelberg in Germany, criticized the UN IPCC summary. "I consider the part of the IPCC report, which I can really judge as an expert, i.e. the reconstruction of the paleoclimate, wrong," Mangini noted in an April 5, 2007 article. He added: "The earth will not die."
Canada: IPCC 2007 Expert Reviewer Madhav Khandekar, a Ph.D meteorologist, a scientist with the Natural Resources Stewardship Project who has over 45 years experience in climatology, meteorology and oceanography, and who has published nearly 100 papers, reports, book reviews and a book on Ocean Wave Analysis and Modeling: "To my dismay, IPCC authors ignored all my comments and suggestions for major changes in the FOD (First Order Draft) and sent me the SOD (Second Order Draft) with essentially the same text as the FOD. None of the authors of the chapter bothered to directly communicate with me (or with other expert reviewers with whom I communicate on a regular basis) on many issues that were raised in my review. This is not an acceptable scientific review process."
Czech Republic: Czech-born U.S. climatologist Dr. George Kukla, a research scientist with the Lamont-Doherty Earth Observatory at Columbia University, expressed climate skepticism in 2007. "The only thing to worry about is the damage that can be done by worrying. Why are some scientists worried? Perhaps because they feel that to stop worrying may mean to stop being paid," Kukla told Gelf Magazine on April 24, 2007.
India: One of India's leading geologists, B.P. Radhakrishna, President of the Geological Society of India, expressed climate skepticism in 2007. "We appear to be overplaying this global warming issue as global warming is nothing new. It has happened in the past, not once but several times, giving rise to glacial-interglacial cycles."
USA: Climatologist Robert Durrenberger, past president of the American Association of State Climatologists, and one of the climatologists who gathered at Woods Hole to review the National Climate Program Plan in July, 1979: "Al Gore brought me back to the battle and prompted me to do renewed research in the field of climatology. And because of all the misinformation that Gore and his army have been spreading about climate change I have decided that ?'real' climatologists should try to help the public understand the nature of the problem."
Italy: Internationally renowned scientist Dr. Antonio Zichichi, president of the World Federation of Scientists and a retired Professor of Advanced Physics at the University of Bologna in Italy, who has published over 800 scientific papers: "Significant new peer-reviewed research has cast even more doubt on the hypothesis of dangerous human-caused global warming."
New Zealand: IPCC reviewer and climate researcher and scientist Dr. Vincent Gray, an expert reviewer on every single draft of the IPCC reports going back to 1990 and author of The Greenhouse Delusion: A Critique of "Climate Change 2001: "The [IPCC] ?'Summary for Policymakers' might get a few readers, but the main purpose of the report is to provide a spurious scientific backup for the absurd claims of the worldwide environmentalist lobby that it has been established scientifically that increases in carbon dioxide are harmful to the climate. It just does not matter that this ain't so."
South Africa: Dr. Kelvin Kemm, formerly a scientist at South Africa's Atomic Energy Corporation who holds degrees in nuclear physics and mathematics: "The global-warming mania continues with more and more hype and less and less thinking. With religious zeal, people look for issues or events to blame on global warming."
Poland: Physicist Dr. Zbigniew Jaworowski, Chairman of the Central Laboratory for the United Nations Scientific Committee on the Effects of Radiological Protection in Warsaw: "We thus find ourselves in the situation that the entire theory of man-made global warming?-with its repercussions in science, and its important consequences for politics and the global economy?-is based on ice core studies that provided a false picture of the atmospheric CO2 levels."
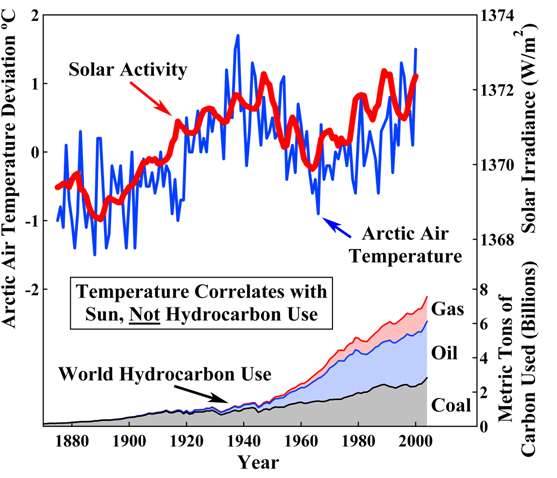
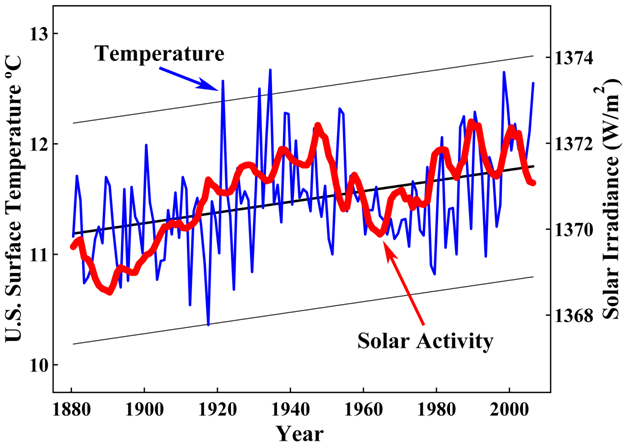
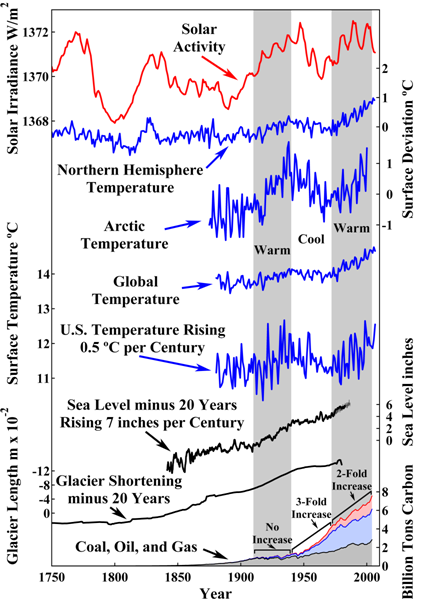
Australia: Prize-wining Geologist Dr. Ian Plimer, a professor of Earth and Environmental Sciences at the University of Adelaide in Australia: "There is new work emerging even in the last few weeks that shows we can have a very close correlation between the temperatures of the Earth and supernova and solar radiation."
Britain: Dr. Richard Courtney, a UN IPCC expert reviewer and a UK-based climate and atmospheric science consultant: "To date, no convincing evidence for AGW (anthropogenic global warming) has been discovered. And recent global climate behavior is not consistent with AGW model predictions."
China: Chinese Scientists Say C02 Impact on Warming May Be ?'Excessively Exaggerated' - Scientists Lin Zhen-Shan's and Sun Xian's 2007 study published in the peer-reviewed journal Meteorology and Atmospheric Physics: "Although the CO2 greenhouse effect on global climate change is unsuspicious, it could have been excessively exaggerated." Their study asserted that "it is high time to reconsider the trend of global climate change."
Denmark: Space physicist Dr. Eigil Friis-Christensen is the director of the Danish National Space Centre, a member of the space research advisory committee of the Swedish National Space Board, a member of a NASA working group, and a member of the European Space Agency who has authored or co-authored around 100 peer-reviewed papers and chairs the Institute of Space Physics: "The sun is the source of the energy that causes the motion of the atmosphere and thereby controls weather and climate. Any change in the energy from the sun received at the Earth's surface will therefore affect climate."
Belgium: Climate scientist Luc Debontridder of the Belgium Weather Institute's Royal Meteorological Institute (RMI) co-authored a study in August 2007 which dismissed a decisive role of CO2 in global warming: "CO2 is not the big bogeyman of climate change and global warming. "Not CO2, but water vapor is the most important greenhouse gas. It is responsible for at least 75 % of the greenhouse effect. This is a simple scientific fact, but Al Gore's movie has hyped CO2 so much that nobody seems to take note of it."
Sweden: Geologist Dr. Wibjorn Karlen, professor emeritus of the Department of Physical Geography and Quaternary Geology at Stockholm University, critiqued the Associated Press for hyping promoting climate fears in 2007. "Another of these hysterical views of our climate. Newspapers should think about the damage they are doing to many persons, particularly young kids, by spreading the exaggerated views of a human impact on climate."
USA: Dr. David Wojick is a UN IPCC expert reviewer, who earned his PhD in Philosophy of Science and co-founded the Department of Engineering and Public Policy at Carnegie-Mellon University: "In point of fact, the hypothesis that solar variability and not human activity is warming the oceans goes a long way to explain the puzzling idea that the Earth's surface may be warming while the atmosphere is not. The GHG (greenhouse gas) hypothesis does not do this." Wojick added: "The public is not well served by this constant drumbeat of false alarms fed by computer models manipulated by advocates."