17
   

Get yer polls, bets, numbers & pretty graphs! Elections 2008


maporsche
 
  1  
Reply Fri 8 Feb, 2008 03:25 pm
Butrflynet wrote:
I did.


What?
0 Replies
 
Butrflynet
 
  1  
Reply Fri 8 Feb, 2008 03:52 pm
maporsche wrote:
Butrflynet wrote:
I did.


What?


1. As soon as Gore made it abundantly clear that he was not going to run, Obama's polling numbers sharply increased.

2. That as soon as Edwards withdrew from the race, Obama's numbers sharply increased again.

3. That the Clinton and Obama lines on the graph were mirror images of each other up until the point of Bill's "mistake" in SC and they have taken off from there and not stopped.

4. That Obama's overall polling popularity is not affected by the outcomes of elections in various states while Clinton's has nearly flat-lined.

5. That a factual display of the overall polling popularity of the Obama candidacy irritates his opponents into making rude posts nearly as much as an emotional display of his popularity by his supporters.
0 Replies
 
Cycloptichorn
 
  1  
Reply Fri 8 Feb, 2008 04:14 pm
That clinton hasn't significantly added any support for about three months. She has hit her roof. Obama has not hit his roof; the slope of the line continues to go up. And there's no reason to think it's going to stop now.

Cycloptichorn
0 Replies
 
maporsche
 
  1  
Reply Fri 8 Feb, 2008 04:26 pm
Butrflynet wrote:
maporsche wrote:
Butrflynet wrote:
I did.


What?


1. As soon as Gore made it abundantly clear that he was not going to run, Obama's polling numbers sharply increased.

2. That as soon as Edwards withdrew from the race, Obama's numbers sharply increased again.

3. That the Clinton and Obama lines on the graph were mirror images of each other up until the point of Bill's "mistake" in SC and they have taken off from there and not stopped.

4. That Obama's overall polling popularity is not affected by the outcomes of elections in various states while Clinton's has nearly flat-lined.

5. That a factual display of the overall polling popularity of the Obama candidacy irritates his opponents into making rude posts nearly as much as an emotional display of his popularity by his supporters.


Sorry, maybe I was paying more attention to you, but these are already things I that we've discussed MANY times, prior to this new chart.
0 Replies
 
fbaezer
 
  1  
Reply Fri 8 Feb, 2008 04:27 pm
Besides the possible propaganda part (and no, I won't discuss over it), Cyclo's graph is indeed very useful. And I think Butrflynet caught its meaning quite well.

It helps us see the race as it should be seen: as moving tendencies.

Too often, near the wake of Supertuesday, just about every poll on this thread has been received as if this was some sort of a popularity contest. Cheers, booing, and head-breaking comments on how things can supposedly change on a day.
THAT'S NOT THE WAY TO READ POLLS.

Things hardly ever change on a day. The big chunk of day-to-day changes in tracking polls are due to different samples (it's polls, not panels what we've been studying), often made by different pollsters who have different house effects. So it's plain silly to go: "Yeah!", "Ohhh!" at a moment's shift.

Tendencies are a different thing. Cyclo's graph helps us to do it. Interpreting the tendencies -just as Butrflynet did, even if I don't think she's totally right- is the art of the pollster-advisor. I think her point number 3 is the kind of stuff a professional pollster-advisor would say.
0 Replies
 
Butrflynet
 
  1  
Reply Fri 8 Feb, 2008 05:16 pm
What parts of my assessment of the graph do you disagree with?

I think I should have expressed #4 better. I should have said that the graph showed hat Obama's overall polling popularity is not negatively affected by the negative outcomes of elections in various states while Clinton's has nearly flat-lined.

And I don't know you well enough to know if being related to a "professional pollster-advisor" is a compliment or not. So, thank you, if it was a compliment.
0 Replies
 
fbaezer
 
  1  
Reply Fri 8 Feb, 2008 05:35 pm
Nº 1 is relevant and likely to be true, though I'd need other data (qualitative polls) to verify it.

On Nº 2. Please take notice on the derivate (the slope). Obama's doesn't change as Edwards retires; Clinton's does. If we were to make a second derivate (to stimate "acceleration"), Hillary's would be positive, and Obama's nearly flat.
This means that Obama's chart moves up due to his previous momentum.
If argument Nº1 works, then it beats argument Nº2. The slope was there, and with a very similar angle, before Edwards called it quits.

Nº3 is the typical relevant stuff a good advisor gets (and Clinton's advisor should have: Bill was not so loud afterwards).

Nº4. Too many assumptions and subjective considerations, IMO. We'd need stickers on every primary voting day to discuss throughly.

I won't comment on Nº5.
0 Replies
 
Cycloptichorn
 
  1  
Reply Fri 8 Feb, 2008 05:37 pm
Number 2 can indicate that Edwards supporters kept the initial surge going, and added a little to Hillary as they reappropriated themselves.

Cycloptichorn
0 Replies
 
fbaezer
 
  1  
Reply Fri 8 Feb, 2008 05:41 pm
Oh, and it was a compliment.
On my odd years I've worked as a pollster-advisor. :wink:

Actually, I left the guy I worked for with a 27 point lead against his opponents in the primaries for Mexico's conservative party. But he was the typical bird-brain who took polls like they were popularity ratings... and understood little of their richness. He decided the race was won (not even one primary had passed!) and, since one of his "weaknesses" was that he was seen as a newcomer in the party, decided to work only with party members.
He finished second place in all but a couple of primaries.

Thank God about that. He would certainly have lost against the populist candidate and we'd have now a Chavez clone in the Presidency.
0 Replies
 
fbaezer
 
  1  
Reply Fri 8 Feb, 2008 05:44 pm
Cycloptichorn wrote:
Number 2 can indicate that Edwards supporters kept the initial surge going, and added a little to Hillary as they reappropriated themselves.

Cycloptichorn


That's a better wording than "2. That as soon as Edwards withdrew from the race, Obama's numbers sharply increased again".
0 Replies
 
Cycloptichorn
 
  1  
Reply Fri 8 Feb, 2008 05:49 pm
fbaezer wrote:
Cycloptichorn wrote:
Number 2 can indicate that Edwards supporters kept the initial surge going, and added a little to Hillary as they reappropriated themselves.

Cycloptichorn


That's a better wording than "2. That as soon as Edwards withdrew from the race, Obama's numbers sharply increased again".


It's only accurate in terms of raw numbers, not in terms of momentum.

How about that slope tho!!! Any candidate would kill for a popularity slope like that

Cycloptichorn
0 Replies
 
fbaezer
 
  1  
Reply Fri 8 Feb, 2008 05:52 pm
Cycloptichorn wrote:
fbaezer wrote:
Cycloptichorn wrote:
Number 2 can indicate that Edwards supporters kept the initial surge going, and added a little to Hillary as they reappropriated themselves.

Cycloptichorn


That's a better wording than "2. That as soon as Edwards withdrew from the race, Obama's numbers sharply increased again".


It's only accurate in terms of raw numbers, not in terms of momentum.


...and fails to mention the Clinton's piece of the Edwards' supporters' pie, which is not irrelevant.
0 Replies
 
Butrflynet
 
  1  
Reply Fri 8 Feb, 2008 05:57 pm
fbaezer wrote:
Oh, and it was a compliment.
On my odd years I've worked as a pollster-advisor. :wink:

Actually, I left the guy I worked for with a 27 point lead against his opponents in the primaries for Mexico's conservative party. But he was the typical bird-brain who took polls like they were popularity ratings... and understood little of their richness. He decided the race was won (not even one primary had passed!) and, since one of his "weaknesses" was that he was seen as a newcomer in the party, decided to work only with party members.
He finished second place in all but a couple of primaries.

Thank God about that. He would certainly have lost against the populist candidate and we'd have now a Chavez clone in the Presidency.


Wow, I envy you! That is my dream job!

One of my monthly tasks while working as an administrative assistant for the CFO at a title insurance company for 18 years was tracking numerous statistics including itemized marketing and budgetary data points so I could interpret and forecast the trends I saw in relationship to industry statistics. Never had any formal training or education to do that, it was just something that interested me so I started doing it and was good at it. Figuring out how things all mesh together in the overall big picture and how the individual parts effect each other has always been an interest of mine.

I'd love to learn more about what you did and how you got the job and the best way to do the same without having the formal training.
0 Replies
 
fbaezer
 
  1  
Reply Fri 8 Feb, 2008 06:07 pm
I'll PM you
0 Replies
 
nimh
 
  1  
Reply Fri 8 Feb, 2008 10:33 pm
Cycloptichorn wrote:
Damnit! I hate when others do that...

sorry

Cycloptichorn

ps it is BIG mo tho, takes a big graph hehehe


Very Happy
0 Replies
 
nimh
 
  1  
Reply Fri 8 Feb, 2008 10:44 pm
fbaezer wrote:
It helps us see the race as it should be seen: as moving tendencies.

Too often, near the wake of Supertuesday, just about every poll on this thread has been received as if this was some sort of a popularity contest. Cheers, booing, and head-breaking comments on how things can supposedly change on a day.
THAT'S NOT THE WAY TO READ POLLS.

Things hardly ever change on a day. The big chunk of day-to-day changes in tracking polls are due to different samples (it's polls, not panels what we've been studying), often made by different pollsters who have different house effects. So it's plain silly to go: "Yeah!", "Ohhh!" at a moment's shift.

Tendencies are a different thing. Cyclo's graph helps us to do it. Interpreting the tendencies [..] is the art of the pollster-advisor.


Hear, hear! I must have said that several dozen times too..

Not that I dont understand the temptation... I do always try to focus on the bigger sequence rather than any individual poll, but I still end up getting caught up in the moment myself too sometimes...
0 Replies
 
nimh
 
  1  
Reply Fri 8 Feb, 2008 10:47 pm
Camp Obama foresees winning 19 of the remaining 27 primaries and caucuses - but losing Texas, Ohio and Pennsylvania

***

Quote:
Obama Campaign Projects Deadlocked Race After Primaries Finish

Feb. 6 (Bloomberg) -- Barack Obama's campaign is forecasting that the Democratic presidential race will remain deadlocked after the primaries end, and the outcome may depend on a fight over whether delegations from Florida and Michigan are counted.

By the time the last primary is held June 7, Obama's advisers project he will have 1,806 delegates to 1,789 for New York Senator Hillary Clinton, according to a document outlining the scenario that was inadvertently attached to a release on delegate counts from yesterday's Super Tuesday primaries.

The forecast doesn't include Florida and Michigan, which were stripped of delegates by the Democratic National Committee for holding primaries ahead of the schedule set out by the party. Clinton, who won uncontested primaries in both states, is vowing a fight to have those delegates -- slated to be 366 in total -- seated at the nominating convention.

``This is only one of an infinite number of scenarios,'' Obama campaign spokesman Bill Burton said, adding that the release of the information was unintended.

Another issue is the so-called super delegates, 796 Democratic officials and officeholders who aren't bound by the results of primaries and caucuses. Obama's campaign projects about half will be pledged to either the Illinois senator or Clinton, and the rest could swing the nomination.

A Draw

After a year of campaigning and 26 contested primaries and caucuses since January, Obama and Clinton have essentially battled to a draw. After yesterday's Super Tuesday voting in 22 states across the country, the two candidates are separated by less than 30 delegates in the nomination race.

Obama's advisers are predicting victories in 19 of the remaining 27 Democratic primaries and caucuses, with Clinton winning the big states of Texas, Ohio and Pennsylvania, according to the campaign document. The final contest is a primary June 7 in Puerto Rico.

Before being penalized, Florida had a total of 210 convention delegates and Michigan had 156.

Clinton, 60, won half the popular vote in Florida's Jan. 29 primary, though none of the candidates publicly campaigned in the state. While she got 55 percent of the vote in Michigan, Obama withdrew his name from the ballot and the next highest vote went to uncommitted.

The campaign document shows Obama, 46, prevailing in Maryland, Virginia and the District of Columbia in next week's primaries. Wins are also forecast in Wisconsin, Oregon and Washington.

Democratic Party rules call for dividing delegates proportionally based on the popular vote, and Obama's campaign anticipates a close race in most states to the end.
0 Replies
 
nimh
 
  1  
Reply Sat 9 Feb, 2008 12:35 am
sozobe wrote:
Interesting:

IMAGE: Active pollsters report card through 020608

From SUSA's site, of course (given that they're at the top of the list).

That was interesting! Thank you. Saves a lot of work too :wink:

They have a fuller version that lists all the pollsters, not only the most active ones, toö:

http://www.surveyusa.com/wp-content/uploads/2008/02/fixed-hi-level-all-pollsters-thru-020608.JPG
0 Replies
 
nimh
 
  1  
Reply Sat 9 Feb, 2008 01:24 am
Sozobe wrote:
http://www.surveyusa.com/wp-content/uploads/2008/02/fixed-active-hi-level-pollster-report-card-through-020608.JPG


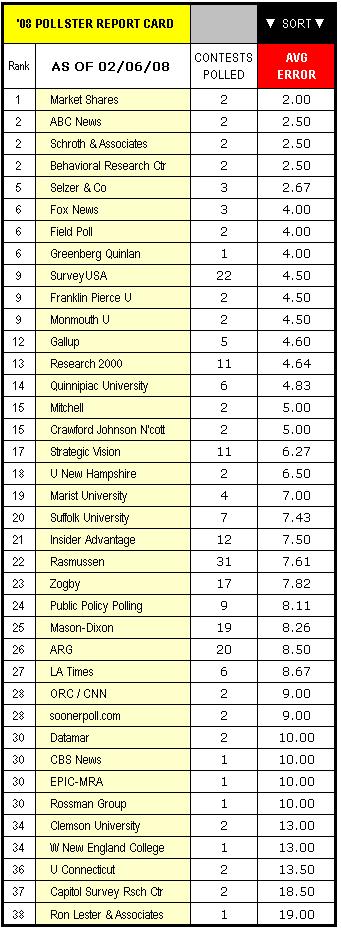
Of the active ones, it's no surprise that ARG ranks almost last. But I was surprised that Mason-Dixon ranked almost as low, and LA Times even lower.

Rasmussen and Zogby didnt do too well either, but then both are relatively controversial.

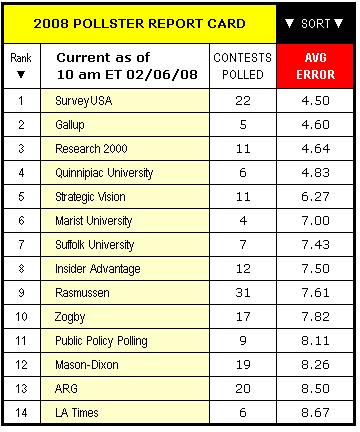
Gallup and Quinnipiac near the top is no surprise, but Research 2000 ranking as high is. And Survey USA's self-praise for ranking first is deserved, especially after the flak it got for its election-eve California poll.

Another measure of pollster accuracy/reliability (with the caveat that pollsters dont actually claim to predict the result, though with last-minute polling the distinction is slight), is to see how often they've really been off. How likely were they to get a result really wrong? Using SUSA's table,

  • ARG was off on the winner's leading margin 10 points or more 9 out of 20 times.
  • LA Times polls, meanwhile, were off 10 points or more 2 out of 6 times. The reason the LA Times polls ranked even below ARG's ones in the SUSA listing is because those two times (in Iowa and NH), they were off a lot.
  • Mason-Dixon was off 10 points or more 5 out of 19 times.
Let's make a full list of that:

How often more than 10 points off?

1. Quinnipiac: 0 out of 6 times
2. Research 2000: 1 out of 11 times
3. Survey USA: 4 out of 22 times
4. Gallup: 1 out of 5 times
5. PPP: 2 out of 9 times
6. InsiderAdvantage: 3 out of 12 times
7. Mason-Dixon: 5 out of 19 times
8. Strategic Vision: 3 out of 11 times
9. LA Times: 2 out of 6 times
10. Rasmussen: 11 out of 31 times
11. Zogby: 7 out of 17 times
12. Suffolk Univ: 3 out of 7 times
13. ARG: 9 out of 20 times
14. Marist Univ: 2 out of 4 times

All in all a rather sobering list. For all but the top 4 pollsters in this list, any poll you may have seen on the eve of the primaries had at least a chance of 1 in 4 of being completely out of whack...

So how often did they really get close? Let's say, how often did they get the winning margin down to 3 points from the actual results at most?

1. Gallup: 4 out of 5 times
2. Survey USA: 13 out of 22 times
3. Marist Univ: 2 out of 4 times
4. Suffolk Univ: 3 out of 7 times
5. Research 2000: 5 out of 11 times
6. Zogby: 7 out of 17 times
7. Quinnipiac: 2 out of 6 times
8. Mason-Dixon: 6 out of 19 times
9. ARG: 6 out of 20 times
10. InsiderAdvantage: 3 out of 12 times
11. PPP: 2 out of 9 times
12. Rasmussen: 6 out of 31 times
13. Strategic Vision: 2 out of 11 times
14. LA Times: 1 out of 6 times

ANother quite sobering list... Most polls get the margin roughly in the ballpark it will actually be in, but this is a good warning not to take the numbers too precisely: chances that it will actually be very close remain quite small but for the most qualified/lucky pollsters.

And I mean, you cant blame them at all for being off 5 or 6 points, in any case. The numbers the SUSA table gives are about how many points the poll was off on the margin between the two leading candidates, meaning that a margin of error applies twice the size of that for any individual candidate's number - so in many cases, 2 x 3% = 6%.

Interesting to see that there are some pollsters that have a lot of variation, coming in either very close or very far off (Marist and Suffolk), whereas others (InsiderAdvantage, PPP, Strategic Vision) have tended to be reliably mediocre.

Any which way you slice it, Gallup and Survey USA are near the top and Research 2000 and Quinnipiac in the top half in all of the three ways to rank the data here. And Rasmussen and especially ARG and the LA Times polls are in the bottom half in any of the three ways.
0 Replies
 
Butrflynet
 
  1  
Reply Sat 9 Feb, 2008 04:27 am
Nimh, fyi, in case you haven't yet seen it. The Obama campaign has posted their spreadsheet of delegate allocations by state and candidate:

http://origin.barackobama.com/resultscenter/
0 Replies


Related Topics

 
Copyright © 2024 MadLab, LLC :: Terms of Service :: Privacy Policy :: Page generated in 0.04 seconds on 09/19/2024 at 07:32:12