72
   

Global Warming...New Report...and it ain't happy news


Ionus
 
  1  
Reply Mon 27 Sep, 2010 12:05 am
@Walter Hinteler,
Walt, I am certain you understand that someone saying what someone said is not good enough to discount a whole argument made by many people.
Walter Hinteler
 
  1  
Reply Mon 27 Sep, 2010 12:36 am
@Ionus,
So you do think that "his" blog is a fake?
parados
 
  0  
Reply Mon 27 Sep, 2010 06:53 am
@Ionus,
Are you going to argue that there have been no criticisms of others or is your approach going to be to keep your head up your behind?
Walter Hinteler
 
  1  
Reply Mon 27 Sep, 2010 09:48 am
Climate change is hitting the insurances very hard, worldwide ...

From the Munich Re Press Release
Quote:
[[...]Floods in central Europe, wildfires in Russia, widespread flooding in Pakistan. The number and scale of weather-related natural catastrophe losses in the first nine months of 2010 was exceptionally high. Two months ahead of the World Climate Summit scheduled for 29 November to 10 December in Cancún, Mexico, Munich Re emphasises the probability of a link between the increasing number of weather extremes and climate change. In the run-up to the summit, Munich Re will focus attention on this issue with a series of communications on natural catastrophes, climate change and potential solutions. Research facts and findings will be available for download in an electronic press folder at www.munichre.com.

Globally, 2010 has been the warmest year since records began over 130 years ago, the ten warmest during that period all falling within the last 12 years. The warmer atmosphere and higher sea temperatures are having significant effects. Prof. Peter Höppe, Head of Munich Re’s Geo Risks Research/Corporate Climate carbon reduction targets stay on the agenda, future generations will bear the consequences.”

[...]

Munich Re’s natural catastrophe database, the most comprehensive of its kind in the world, shows a marked increase in the number of weather-related events. For instance, globally there has been a more than threefold increase in loss-related floods since 1980 and more than double the number of windstorm natural catastrophes, with particularly heavy losses as a result of Atlantic hurricanes.

The rise in natural catastrophe losses is primarily due to socio-economic factors. In many countries, populations are rising, and more and more people moving into exposed areas. At the same time, greater prosperity is leading to higher property values. Nevertheless, it would seem that the only plausible explanation for the rise in weather-related catastrophes is climate change. The view that weather extremes are more frequent and intense due to global warming coincides with the current state of scientific knowledge as set out in the Fourth IPCC Assessment Report.

... ... ...
ican711nm
 
  0  
Reply Mon 27 Sep, 2010 01:14 pm
@parados,
parados wrote:
If we can show to you that Chris Allen isn't a meteorologist will you stop posting from a source that is lying to you?

"If [you]can show to [me] that Chris Allen isn't a meteorologist," I will believe Chris Allen isn't a meteorologist.
I will then believe my source made one error.
One error is not evidence of my source lying to me.
However, if [you] can show to [me] that more than 2% (more than 9 of 463) of the references my source has provided me is in error, I will at minimum think my source unreliable.
0 Replies
 
ican711nm
 
  0  
Reply Mon 27 Sep, 2010 01:30 pm
THE AVERAGE AND MEAN ANNUAL GLOBAL TEMPERATURES INCREASED ABOUT 1°C (1.8°F) IN THE LAST 100 YEARS.
Quote:

http://epw.senate.gov/public/index.cfm?FuseAction=Minority.Blogs&ContentRecord_id=f80a6386-802a-23ad-40c8-3c63dc2d02cb
As of December 20, 2007, more than 400 prominent scientists from more than two dozen countries have voiced significant objections to major aspects of the alleged UN IPCC "consensus" on man-made global warming.
Quote:

402
Economist Dr. Arnold Kling, formerly of the Federal Reserve Board and Freddie Mac, expressed man-made climate skepticism in 2007. “I am worried about climate change. In one respect, I may be more worried than other people. I am worried because I have very little confidence that we know what is causing it,” Kling wrote in a December 21, 2007 commentary. “One of my fears is that we could reduce carbon emissions by some drastic amount, only to discover that--oops--it turns out that climate change is being caused by something else,” Kling explained. “I am not a skeptic about the rise in average temperatures. Nor am I skeptical that the amount of carbon dioxide in the atmosphere has been increasing. However, I remain skeptical about the connection between the two,” he wrote. (LINK)

0 Replies
 
ican711nm
 
  1  
Reply Mon 27 Sep, 2010 01:32 pm
http://www.cru.uea.ac.uk/cru/data/temperature/nhshgl.gif

http://www.cru.uea.ac.uk/cru/data/temperature/nhshgl.gif
Average Annual Global Temperature 1850-2010.

During the 100 year period, 1910 to 2010, the average annual global temperature increased about 1°C (1.8°F).

http://www.ncdc.noaa.gov/img/climate/research/global-jan-dec-error-bar-pg.gif

http://www.ncdc.noaa.gov/img/climate/research/global-jan-dec-error-bar-pg.gif
Jan-Dec Global Mean Temperature over Land & Ocean

During the 100 year period, 1910 to 2010, the mean annual global temperature increased about 1°C (1.8°F).

0 Replies
 
mysteryman
 
  1  
Reply Wed 6 Oct, 2010 10:08 am
I found this, and cant help but wonder if the global warming crowd really thinks this is effective...

http://online.wsj.com/article/SB10001424052748704380504575530882705081398.html

And here is the actual video...

http://www.youtube.com/watch?v=sSTLDel-G9k
Walter Hinteler
 
  1  
Reply Wed 6 Oct, 2010 02:39 pm
@mysteryman,
mysteryman wrote:

I found this, and cant help but wonder if the global warming crowd really thinks this is effective...


To be honest: I would be very suspecious, too, since not only the Methodist Church and the Baptists joined this campaign but the Conservative Party, too ...
mysteryman
 
  1  
Reply Wed 6 Oct, 2010 10:45 pm
@Walter Hinteler,
So you think they approved of the video?
Walter Hinteler
 
  1  
Reply Thu 7 Oct, 2010 12:03 am
@mysteryman,
No idea - but they and some thousand more organisations and institutions etc are members of this group.

Perhaps, you can find their reaction online as well?
mysteryman
 
  1  
Reply Thu 7 Oct, 2010 12:25 am
@Walter Hinteler,
Thats what I am trying to do.
I personally found the video to be offensive, and a very poor way to try and make a point.
0 Replies
 
High Seas
 
  1  
Reply Thu 7 Oct, 2010 03:08 am
@Walter Hinteler,
The Conservative Party?
http://www.sciencecartoonsplus.com/gallery/geology/geology09.gif
spendius
 
  1  
Reply Thu 7 Oct, 2010 04:38 am
Why didn't the teacher blow the globe up?

Utter fatuity. Patronising, hypocritical, style-free bullshit.
0 Replies
 
ican711nm
 
  0  
Reply Thu 7 Oct, 2010 11:06 am
During the 100 year period, 1910 to 2010, the mean annual global temperature increased about 1°C (1.8°F).

Was that caused by the density of CO2 in the atmosphere allegedly about doubling over the same period?

0 Replies
 
MontereyJack
 
  1  
Reply Thu 7 Oct, 2010 11:55 am
CAN YOU DO SIMPLE ARITHMETIC, ICAN? APPARENTLY NOT
The preindustiral level of CO2 was for centuries pretty stable at around 280ppm. Doubling that would be 560ppm. It is currently around 383 ppm--a far cry from 560. In other words, roughly a quarter of the CO2 in the atmosphere today is anthropogenic in origin. However the increase at the present time is somewhat higher than linear and we will eventually, if current fossil fuel consumption rates continue, hit 560ppm, and the current estimate is that that will cause an increase of 3-4 degrees C in the annual global temperature. Keep in mind that the difference in global temperature between the last ice age, when much of North America was covered with a mile-thick ice pack, and today is only about 5-6 degrees C, so if you think that an increase of 3-4 degrees C merely means that summers will be say 5 degrees F warmer, you're wrong. That's not the way global average temp works.

Furthermore, as you should know by now, the IPCC, and climate researchers have for more than a decade quantized the effects on tempoerature of the various forcings and feedbacks that effect it. Roughly 60% is due to CO2. And now that we have a longer timeline of direct satellite measurement of the sun's contribution to warming, the sun's effect has been scaled downward, since as you should know solar output has been DECREASING since we have been able to measure it directly in the mid-70s, while global temperature has been INCREASING as CO2 INCREASES.
ican711nm
 
  0  
Reply Thu 7 Oct, 2010 12:33 pm
@MontereyJack,
During the 100 year period, 1910 to 2010, the mean annual global temperature increased about 1°C (1.8°F).

Was that caused by the density of CO2 in the atmosphere allegedly increasing about 383/280 = 1.367857143 over the same period?

Did that alleged increase in CO2 atmospheric density cause about the alleged 60% of that 1°C (1.8°F)?

0 Replies
 
MontereyJack
 
  1  
Reply Thu 7 Oct, 2010 08:58 pm
YES
ican711nm
 
  2  
Reply Fri 8 Oct, 2010 02:41 pm
@MontereyJack,
During the 100 year period, 1910 to 2010, the mean annual global temperature increased about 1°C (1.8°F).

Was that caused by the density of CO2 in the atmosphere allegedly increasing about 383/280 = 1.367857143 over the same period?

Did that alleged increase in CO2 atmospheric density cause about the alleged 60% of that 1°C (1.8°F)?

NO, not likely!

HUMAN CAUSED CO2 EMISSIONS INTO THE ATMOSPHERE ARE NOT THE PRIMARY CAUSE OF THE LESS THAN THE 1°K = 1°C = 1.8°F AVERAGE ANNUAL GLOBAL TEMPERATURE INCREASE WITHIN THE LAST 100 YEARS.!

Quote:

http://co2.cms.udel.edu/Increasing_Atmospheric_CO2.htm
Emissions of Carbon from Human Activities
Several human activities release CO2 into the atmosphere (called anthropogenic, human-origin, emissions). Fossil-fuel burning is the predominant anthropogenic source of CO2, but cement production and other activities also contribute (including the “land-use” activity of deforestation). Using a combination of modern and historic data, scientists estimate that humans have sent a total of 305 billion metric tons of carbon into the atmosphere since 1751; half of these emissions have occurred since the mid-1970s.

About half of the recent emissions are not accumulating in the atmosphere, but are going into the ocean and, to a lesser extent, into soils. These are considered “sinks” in the global carbon budget because they take up atmospheric CO2.

Quote:

http://researchnews.osu.edu/archive/nowarm.htm
He [Essenhigh] cites a 1995 report from the Intergovernmental Panel on Climate Change (IPCC), a panel formed by the World Meteorological Organization and the United Nations Environment Programme in 1988 to assess the risk of human-induced climate change. In the report, the IPCC wrote that some 90 billion tons of carbon as carbon dioxide annually circulate between the earth's ocean and the atmosphere, and another 60 billion tons exchange between the vegetation and the atmosphere.

Compared to man-made sources' emission of about 5 to 6 billion tons per year, the natural sources would then account for more than 95 percent of all atmospheric carbon dioxide ...


What is the scientifically validated formula for computing how much of an average global temperature increase will will result from a given CO2 ppm increase in the atmosphere ?

What is the scientifically validated formula for computing how much of an average global temperature increase will result from a given CO2 metric ton increase in the atmosphere ?


AVERAGE ANNUAL GLOBAL REMPERATURE ANOMALIES IN DEGREES KELVIN, 1900 - 2007

1900 -0.0281
1901 -0.0974
1902 -0.1735
1903 -0.2929
1904 -0.3284
1905 -0.2159
1906 -0.1798
1907 -0.3467
1908 -0.3768
1909 -0.3808
1910 -0.3656
1911 -0.3621
1912 -0.3037
1913 -0.2861
1914 -0.1133
1915 -0.0558
1916 -0.2710
1917 -0.3264
1918 -0.2098
1919 -0.2070
1920 -0.1674
1921 -0.1225
1922 -0.2142
1923 -0.1904
1924 -0.1848
1925 -0.1143
1926 -0.0213
1927 -0.0993
1928 -0.0979
1929 -0.2245
1930 -0.0250
1931 -0.0035
1932 -0.0269
1933 -0.1605
1934 -0.0243
1935 -0.0495
1936 -0.0178
1937 0.0827
1938 0.0979
1939 0.0748
1940 0.1163
1941 0.1380
1942 0.1242
1943 0.1178
1944 0.2134
1945 0.0667
1946 -0.0289
1947 -0.0304
1948 -0.0414
1949 -0.0681
1950 -0.1555
1951 -0.0118
1952 0.0339
1953 0.1128
1954 -0.1115
1955 -0.1314
1956 -0.1878
1957 0.0490
1958 0.0994
1959 0.0530
1960 0.0048
1961 0.0745
1962 0.0979
1963 0.1272
1964 -0.1399
1965 -0.0732
1966 -0.0298
1967 -0.0142
1968 -0.0213
1969 0.0786
1970 0.0324
1971 -0.0643
1972 0.0178
1973 0.1429
1974 -0.1047
1975 -0.0319
1976 -0.1107
1977 0.1282
1978 0.0503
1979 0.1406
1980 0.1887
1981 0.2293
1982 0.1133
1983 0.2716
1984 0.0798
1985 0.0625
1986 0.1496
1987 0.2870
1988 0.2888
1989 0.2087
1990 0.3700
1991 0.3241
1992 0.1894
1993 0.2227
1994 0.2815
1995 0.3981
1996 0.2586
1997 0.4615
1998 0.5764
1999 0.3947
2000 0.3630
2001 0.4934
2002 0.5573
2003 0.5565
2004 0.5337
2005 +0.6046
2006 0.5394
2007 0.5484

2005 +0.6046
1909 -0.3808
Difference = 0.9854°K = 1.7737°F


http://www.ncdc.noaa.gov/img/climate/research/2007/ann/global-jan-dec-error-bar-pg.gif
Trend in global average Temperature 1880 to 2007


http://www.oism.org/pproject/Slides/Presentation/Slide5.png
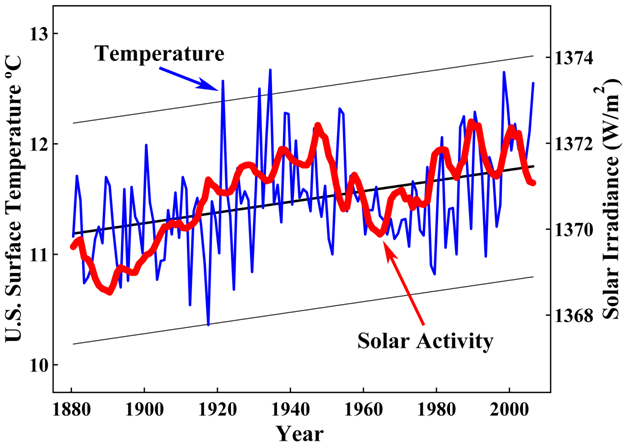
US Surface Temperature Trends versus Solar Activity 1880 to 2007


0 Replies
 
Ionus
 
  0  
Reply Sat 9 Oct, 2010 05:11 am
@Walter Hinteler,
I rely on what would be acceptable evidence in a court. I dont believe every piece of information on the web.
0 Replies


Related Topics

 
Copyright © 2025 MadLab, LLC :: Terms of Service :: Privacy Policy :: Page generated in 0.12 seconds on 02/06/2025 at 10:35:31