Well, in the infamous programmer's acronym, GIGO--Garbage In, Garbage Out. Your argument can only be as good as your premises. And ican's premises as usual start with that capital G.
Actually the change in total solar irradiance is zero. I repeat, change in Total Solar Irradiance is ZERO. You can use ican's wacked mathematics if you want, but it's clear that even if you do, the effect of TSI on increased global temperature is ZERO percent. TSI-caused increased outgassing of CO2 from the oceans is ZERO. Because TSI has not increased.
For one thing, accurate measures of solar irradiance really only became possible with satellite sensors in 1978. Before then, such as ican's starting point of 1975, radiosondes and high altitude flights typically had possible errors of about +/- 3 watts, not much good when you're attempting to measure something where you want accuracy to a tenth of a watt per square meter.
But, hey, I'll take ican's figure of 1371 w/m^2 for 1975(even though the National Research Council, part of the NAS, called it 1367.1 in Decade-to-Century Scale Climate Variability and Change:A Science Strategy). Of course using 1975 and either datum actually results in DECREASE in TSI roughly twice as big as ican's alleged increase (if you use the NRC figure) or a DECREASE six times as big (if you use ican's figure). But hey, ican, go for it.
Now suspected increases in TSI are generally based on differences in irradiance at solar minima in the (nominally) 11-year sunspot cycle. The 11-year differences in maxima and minima are around 2 W/m^2, and that, according to Jim Hansen, barely shows up in the climate picture--at around 0.! degree centigrade (and it is of course cyclic and has been for thousands of years, so is not a factor in any recent climate change). And change in solar irradiance is going to be at most a tenth of that, and on the recent variation, not even that high.
So what we were left with, until the last couple months, were essentially two relatively accurate data points to work with--the solar minima of (roughly) 1986 and 1996. And indeed 1996 was slightly higher than 1986. To the extent that ican's data ever make any sense, I would assume those are the points he is using for his period 1975-2005. HOWEVER, we have just passed the solar minimum that ended cycle 23 in Dec.07-Jan08,and started cycle 24. And the preliminary data show that the minimum was negligibly different from the cycle 21 minimum in 86, and may actually, in some of the graphs I've seen be somewhat lower. Which means that TSI is not increasing. And the '07 value was about 1365.1, which makes it about 6 W/m^2 LESS than ican's 1975 figure. For example, a graph of TSI over the last several decade, slightly before the last minimum (even then below the previous minima )http://publishing.royalsociety.org/media/proceedings_a/rspa20071880.pdf
ican's contention thus fails: TSI cannot be shown to be increasing, so none of the effects he contends are happening because of increasing TSI (several of which are nonsense) and hence are the cause of global temperature rise, are attributable to increase in TSI, since it's not increasing.
Try something else, ican, that bird don't fly.


You're not interpreting them correctly, ican. It's your problem not mine.
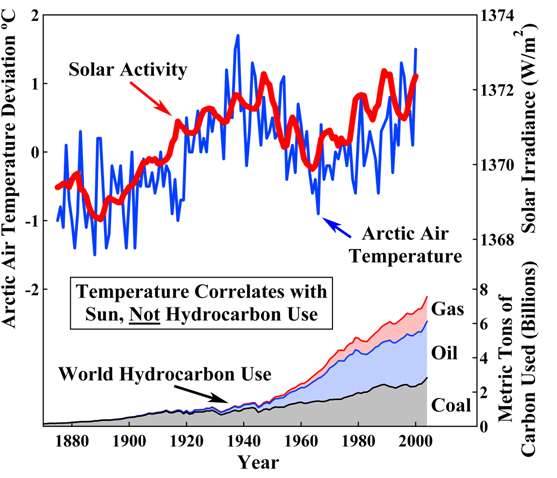
And average TSI has been declining since the 86 minimum, at the same time temp has been going up. Solar variability doesn't explain what's happening. Sorry, but that's the fact.
...
The net effect HAS been constant for centuries until humans started adding CO2.