71
   

Global Warming...New Report...and it ain't happy news


Foxfyre
 
  1  
Reply Wed 5 Mar, 2008 10:31 am
parados wrote:
Which claims were wrong Fox?

It's quite easy to find the claims the court had issue with. In many cases they are the same ones I had issue with when I saw the film because they had been raised early on about the film. None of the claims the court had issue with concern whether warming is occurring or not.


Whether warming is occurring or not has never been the issue, however. Whether human activity is causing any warming and the draconian measures laid out as necessary to stop such activity and reverse the presume impending global catastrophe is the issue. Of course there will be periods of warming along with periods of cooling. The overall trend since the last ice age has been one of warming, thank goodness. Who wants to live in an ice age?

In Coleman's briefs I linked you to are named many quite distinguished scientists with impressive credentials who aren't buying into the alarmist theories. They all attribute most global warming to be from mostly natural factors, discredit the draconian measures being demanded to stop global warming as being ineffective and unnecessary, and refuse to join in the 'sky is falling' theories being put out there for sociopolitical reasons.

The judge quite accurately nailed that aspect of the debate and, in my opinion, arrived at the correct decision.
0 Replies
 
parados
 
  1  
Reply Wed 5 Mar, 2008 10:55 am
Foxfyre wrote:


Whether warming is occurring or not has never been the issue, .

That's an interesting statement Fox since John Coleman in his Fox interview says it is NOT occurring. It seems he thinks it IS an issue which is why I called him an idiot. Are you sure you want to defend him?
0 Replies
 
parados
 
  1  
Reply Wed 5 Mar, 2008 11:21 am
Here is another example of Coleman's faulty logic..
Quote:
NASA has recently reprocessed its annual data for US temperatures since 1840. Here is their revised list of the
warmest years:
Year Old New
1934 1.23 1.25
1998 1.24 1.23
1921 1.12 1.15
2006 1.23 1.13
1931 1.08 1.08
1999 0.94 0.93
1953 0.91 0.90
1990 0.88 0.87
1938 0.85 0.86
1939 0.84 0.85
Three years from the 1990's make the list, but only one in this new century. It seems clear to me that we are
not in the grips of massive man-made heat wave called global warming.

So lets see. That is now twice that Coleman has given localized data to refute arguments about the global warming.
0 Replies
 
Foxfyre
 
  1  
Reply Wed 5 Mar, 2008 11:22 am
Depends on the context in which he said that. If he means right now or in 2007, I think he is probably right. If his intent was to say that AGW is not occurring to any significant degree, I think he has a lot of high powered support in that opinion.
0 Replies
 
parados
 
  1  
Reply Wed 5 Mar, 2008 11:24 am
Foxfyre wrote:
Depends on the context in which he said that. If he means right now or in 2007, I think he is probably right.


Laughing
0 Replies
 
Foxfyre
 
  1  
Reply Wed 5 Mar, 2008 11:31 am
parados wrote:
Here is another example of Coleman's faulty logic..
Quote:
NASA has recently reprocessed its annual data for US temperatures since 1840. Here is their revised list of the
warmest years:
Year Old New
1934 1.23 1.25
1998 1.24 1.23
1921 1.12 1.15
2006 1.23 1.13
1931 1.08 1.08
1999 0.94 0.93
1953 0.91 0.90
1990 0.88 0.87
1938 0.85 0.86
1939 0.84 0.85
Three years from the 1990's make the list, but only one in this new century. It seems clear to me that we are
not in the grips of massive man-made heat wave called global warming.

So lets see. That is now twice that Coleman has given localized data to refute arguments about the global warming.


So how is the logic faulty? Seems quite reasonable to me. It isn't his figures he is using but NASA's. Where did he interpret it incorrectly?
0 Replies
 
miniTAX
 
  1  
Reply Wed 5 Mar, 2008 11:31 am
parados wrote:
So lets see. That is now twice that Coleman has given localized data to refute arguments about the global warming.

Well, given the data density for the "rest of the world" (see the map, one point =1 T station, not a single rural station with up to date data for Africa or China, not ONE), I presume this veteran number crunching weatherman who has some familiarities with statistics has some reasons to restrict to the US.

http://www.climateaudit.org/wp-content/uploads/2008/03/adjust91.gif
0 Replies
 
miniTAX
 
  1  
Reply Wed 5 Mar, 2008 11:38 am
parados wrote:
He uses a chart of Europe to combat Mann's chart of global temperatures.
If you had seen on a world map what makes Mann's "global" temperature ... Rolling Eyes
0 Replies
 
Walter Hinteler
 
  1  
Reply Wed 5 Mar, 2008 11:38 am
Foxfyre wrote:
The judge quite accurately nailed that aspect of the debate and, in my opinion, arrived at the correct decision.


Well, I agree that it can't be really dounted.

Mr. Justice Burton wrote:
I turn to AIT, the film. The following is clear:

It is substantially founded upon scientific research and fact, albeit that the science is used, in the hands of a talented politician and communicator, to make a political statement and to support a political programme.
0 Replies
 
parados
 
  1  
Reply Wed 5 Mar, 2008 11:38 am
The US land mass makes up 2% of the globe. Do you see a problem with only using the US data from NASA since NASA also provides global data?


If you are using 2% of data not taken at random as your data source then you will have a flawed outcome. C'mon miniTax, even you should know that before you claim someone familiar with statistics would make such an obvious mistake.
0 Replies
 
parados
 
  1  
Reply Wed 5 Mar, 2008 11:50 am
miniTAX wrote:
parados wrote:
He uses a chart of Europe to combat Mann's chart of global temperatures.
If you had seen on a world map what makes Mann's "global" temperature ... Rolling Eyes


So you are arguing that Mann only used trees and ice cores from Europe?
Rolling Eyes
0 Replies
 
miniTAX
 
  1  
Reply Wed 5 Mar, 2008 11:52 am
parados wrote:
The US land mass makes up 2% of the globe. Do you see a problem with only using the US data from NASA since NASA also provides global data?


If you are using 2% of data not taken at random as your data source then you will have a flawed outcome. C'mon miniTax, even you should know that before you claim someone familiar with statistics would make such an obvious mistake.
The "global" temperature by NASA is derived of the station network shown on the graph above!
You're claiming it'd be more valid to discuss about a global temperature taken with some dozen stations for ALL oceans (70% of Earth surface) and no up to date rural stations for Africa & China (and other vast areas) instead of discussing about trends in the US to extrapolate to the globe.
Statistically, one claim is as silly than the other.
0 Replies
 
miniTAX
 
  1  
Reply Wed 5 Mar, 2008 11:54 am
parados wrote:
So you are arguing that Mann only used trees and ice cores from Europe?
Rolling Eyes
I'm arguing Mann is issuing a worlwide crap instead of a Europe centered crap. Not a real big deal.
0 Replies
 
Walter Hinteler
 
  1  
Reply Wed 5 Mar, 2008 11:55 am
miniTAX wrote:
... I presume this veteran number crunching weatherman who has some familiarities with statistics has some reasons to restrict to the US ...


Certainly Coleman has been a very famous television weathercaster.
A weatherman, as you said.

And it seems that Coleman has a BA, in some subject.
It's not listed on any of his biographies, even the one at the station he is presently working at, KUSI-TV in San Diego.
You would think if he actually had a degree in meteorolgy they would say so. Especially, since the "Chicago School" of meteorology has been quite famous.
0 Replies
 
miniTAX
 
  1  
Reply Wed 5 Mar, 2008 12:03 pm
Walter Hinteler wrote:

And it seems that Coleman has a BA, in some subject.
It's not listed on any of his biographies, even the one at the station he is presently working at, KUSI-TV in San Diego.
You would think if he actually had a degree in meteorolgy they would say so. Especially, since the "Chicago School" of meteorology has been quite famous.
He is so old that maybe there was no meteorology college degree at his times Laughing
Anyway, what is sure that he is not only a TV presenter.

John Coleman has been a TV weatherman in Champaign,
Peoria, and Chicago, Illinois; Omaha, Nebraska; Milwau-
kee, Wisconsin; and New York City. He was the original
weathercaster on what was then the brand-new ABC network morn-
ing program, Good Morning America . He stayed seven years, then
founded The Weather Channel, serving as its CEO and president dur-
ing the startup and its first year of operation. After The Weather Chan-
nel he became weather anchor at WCBS-TTV in New York and then at
WMAQ-TTV in Chicago, before moving to Southern California to join
the independent television station, KUSI-TTV in San Diego, in what he
fondly alls is retirement job. "
[email protected]
0 Replies
 
Foxfyre
 
  1  
Reply Wed 5 Mar, 2008 12:08 pm
Coleman admits he is not as formally credentialed as some. He apparently only recently 'came out of the closet' as a AGW skeptic:

http://media.kusi.clickability.com/documents/REMARKS+OF+JOHN+COLEMAN.pdf
0 Replies
 
Walter Hinteler
 
  1  
Reply Wed 5 Mar, 2008 12:11 pm
miniTAX wrote:
He is so old that maybe there was no meteorology college degree at his times Laughing


The "Chicago School" of meteorology was already famous before WWII - he got his degree in 1957.
0 Replies
 
High Seas
 
  1  
Reply Wed 5 Mar, 2008 12:16 pm
So it's come to blows in the NY conference ...Smile


http://blogs.wsj.com/environmentalcapital/2008/03/03/heating-up-the-global-warming-debate-if-there-still-is-one/

http://www.heartland.org/NewYork08/ConferenceBios.pdf
0 Replies
 
ican711nm
 
  1  
Reply Wed 5 Mar, 2008 04:40 pm
parados wrote:
Quote:
F = fraction of atmospheric CO2 caused by humans = 0.05

H = human caused TnotS = F x TnotS
H = 0.05 x 0.4271 °K = 0.02136 °K
H = 0.02136 °K

% Temperature increase that is Human caused = TiHc = H / Ti = 100% x 0.02136 °K / 0.6365 °K = 3.36%
TiHc = 3.36%
A MINOR EFFECT!

Major error in your math.. (We will ignore your silly unsupported assumptions for now.)
...

Rolling Eyes
Yes, there WERE major errors in that part of my previous post. That's why I deleted that part. Pay attention! I deleted it ABOUT AN HOUR before you posted this post of yours.

Here is my corrected version.

QUESTION: Human actions have made a Question contribution to the increase in global temperature 1975 to 2005 { Trivial = less than 1%; Minor = 1% to less than 5%; Secondary = 5% to less than 50%; Primary = 50 to less than 100%; Exclusive = 100%.}?

--------------------------------------------------
1975 to 2005
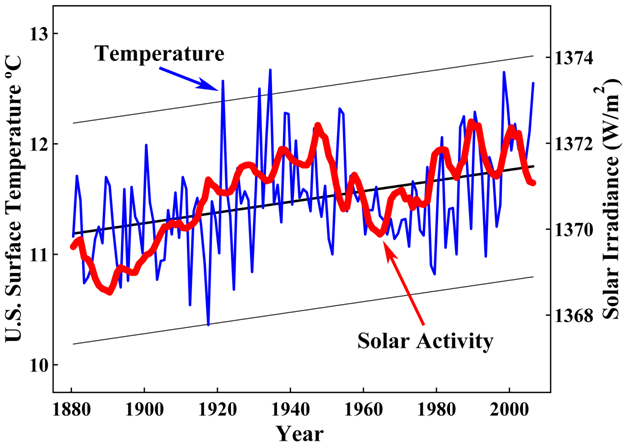
S = solar irradiance average = 1371 w/m^2.
Si = solar irradiance increase = 1.0 w/m^2.
Si% = solar irradiance %increase = 100% x Si w/m^2 / S = 100% x 1.0 w/m^2 / 1371 w/m^2 = 0.07294%.
Si% = 0.07294%.

T = global temperature average= 287.06 °K.
Ti = global temperature increase = 0.6046 °K + 0.0319 °K = 0.6365 °K.
Ti% = global temperature %increase = 100% x Ti / T = 100% x 0.6365 °K / 287.06 °K = 0.2217%.
Ti% = 0.2217%.

Ti% - Si% = 0.2217% - 0.07294% = 0.1488%.
Ti% - Si% = 0.1488%.

TnotS = Temperature increase not caused by solar irradiance increase = 0.1488% x 287.06 °K / 100%..
TnotS = 0.4271 °K.

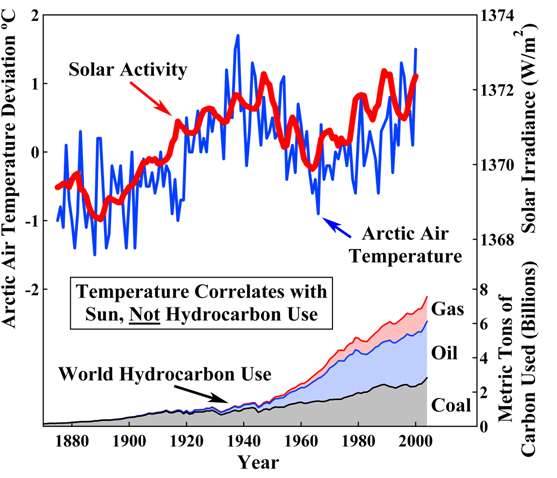
"IPCC wrote that some 90 billion tons of carbon as carbon dioxide annually circulate between the earth's ocean and the atmosphere, and another 60 billion tons exchange between the vegetation and the atmosphere. Compared to man-made sources' emission of about 5 to 6 billion tons per year, the natural sources would then account for more than 95 percent of all atmospheric carbon dioxide."

F = %atmospheric CO2 caused by humans = 100% x 6 / (90+60) = 4%.
F = 4%.

H = human caused TnotS = F x TnotS = 4% x 0.4271 °K / 100% = 0.01708 °K.
H = 0.01708 °K.

TiHc = % Temperature increase that is Human caused = H / Ti = 100% x 0.01708 °K / 0.6365 °K = 2.684%.
TiHc = 2.684%.

Human actions have made a Minor contribution to the increase in global temperature 1975 to 2005 { Trivial = less than 1%; Minor = 1% to less than 5%; Secondary = 5% to less than 50%; Primary = 50 to less than 100%; Exclusive = 100%.}.
-------------------------------------------------
0 Replies
 
ican711nm
 
  1  
Reply Wed 5 Mar, 2008 05:52 pm
Quote:

ftp://ftp.ncdc.noaa.gov/pub/data/anomalies/annual.land_and_ocean.90S.90N.df_1901-2000mean.dat
1880 thru 2007, Tabulated Yearly Mean Measurements Atmospheric CO2

1975 -0.0319
1976 -0.1107
1977 0.1282
1978 0.0503
1979 0.1406
1980 0.1887
1981 0.2293
1982 0.1133
1983 0.2716
1984 0.0798
1985 0.0625
1986 0.1496
1987 0.2870
1988 0.2888
1989 0.2087
1990 0.3700
1991 0.3241
1992 0.1894
1993 0.2227
1994 0.2815
1995 0.3981
1996 0.2586
1997 0.4615
1998 0.5764
1999 0.3947
2000 0.3630
2001 0.4934
2002 0.5573
2003 0.5565
2004 0.5337
2005 0.6046
2006 0.5394
2007 0.5484

Add each of these anomalies to the 1901 - 2000 global average = 287.06°K, to obtain actual temperature in degrees Kelvin.

Quote:

http://www.ncdc.noaa.gov/oa/climate/research/2007/ann/global.html
The 1901-2000 average combined land and ocean annual temperature is 13.9°C (56.9°F), the annually averaged land temperature for the same period is 8.5°C (47.3°F), and the long-term annually averaged sea surface temperature is 16.1°C (60.9°F).
Average annual temperature = 13.9 + 273.16 = 287.06°K

Quote:

http://co2.cms.udel.edu/Increasing_Atmospheric_CO2.htm
About half of the recent emissions are not accumulating in the atmosphere, but are going into the ocean and, to a lesser extent, into soils. These are considered "sinks" in the global carbon budget because they take up atmospheric CO2.

http://www.oism.org/pproject/Slides/Presentation/Slide5.png
!!!US Surface Temperature Trends versus Solar Activity


http://www.oism.org/pproject/Slides/Presentation/Slide3.png
!!!Arctic Air Temperature; CO2; Solar Radiation
0 Replies


Related Topics

 
Copyright © 2024 MadLab, LLC :: Terms of Service :: Privacy Policy :: Page generated in 0.1 seconds on 10/08/2024 at 06:37:13