parados wrote:Your math on the Celsius increase is interesting...
Hadcrut3 data1900 -.223
2005 +.482
How you got .5 out of adding those 2 numbers together is beyond me. I get .705 Celsius.
That comes out to .24% if taken from kelvin zero.
But lets do a true 100 years.
1907 is -.507
2007 is +.402
That comes out to .909 increase in temperature at .31%
My numbers were my estimated approximations based on these four graphs:

Trend in global average Temperature 1880 to 2007

!!!Trend Atmospheric CO2 ppm 1958 to 2007
Solar Irradiance Increase 1907 to 2007 = 2 W/M^2
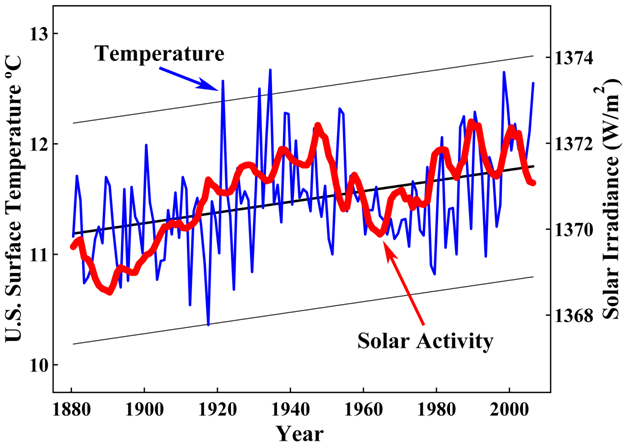
US Surface Temperature Trends versus Solar Activity
Irradiance ratio 2/1370 = 0.00146
Global Temperature Increase 1975 to 2007 = 0.5 K
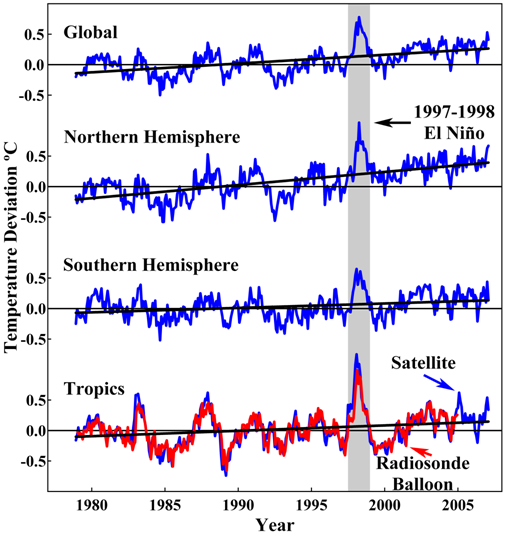
Temperatures versus years
Temperature ratio 0.5/287 = 0.00174
difference of ratios = 0.00174 - 0.00146 = 0.00028
Temperature increase due to other than solar irradiance increase = 0.00028 x 287 K = 0.0804 K
ASSUMING all of that 0.0804 K temperature increase is caused by CO2 in the atmosphere and:
5 % of CO2 in the atmosphere is derived from human emissions of CO2 into the atmosphere;
95 % of CO2 in the atmosphere is derived from evaporation of surface water mixed with CO2;
Then .05 x 0.0804 K = 0.00402 K increase caused by human emissions of CO2 into the atmosphere.
Therefore, the temperature increase caused by human emissions of CO2 into the atmosphere = 100% x 0.00402 K / 0.5 K = 0.201 %.
------------------------------------------------
However, If I use your 0.909 K increase in temperature I get the following result:
Solar Irradiance Increase 1907 to 2007 = 2 W/M^2
Irradiance ratio 2/1370 = 0.00146
For Global Temperature Increase 1907 to 2007 = 0.5 K
Temperature ratio 0.909/287 = 0.00317
difference of ratios = 0.00317 - 0.00146 = 0.00171
Temperature increase due to other than solar irradiance increase = 0.00171 x 287 K = 0.491 K
ASSUMING all of that 0.491 K temperature increase is caused by CO2 in the atmosphere and:
5 % of CO2 in the atmosphere is derived from human emissions of CO2 into the atmosphere;
95 % of CO2 in the atmosphere is derived from evaporation of surface water mixed with CO2;
Then .05 x 0.491 K = 0.0246 K increase caused by human emissions of CO2 into the atmosphere.
Therefore, the temperature increase caused by human emissions of CO2 into the atmosphere = 100% x 0.0246 K / 0.5 K = 4.92%.
------------------------------------------------------------
Whether or not your temperature increase number or mine is correct, the amount of global temperature increase 1907 to 2007 caused by human emissions is
minor compared to the temperature increase caused by solar irradiance plus evaporation of surface water mixed with CO2 that is evaporated into the atmosphere.
I invite further criticism of my calculations based on other human effects such as land use.
