17
   

Get yer polls, bets, numbers & pretty graphs! Elections 2008


Cycloptichorn
 
  1  
Reply Mon 19 May, 2008 09:54 am
sozobe wrote:
That's Portland though. Remember that the largest one until then was in Philadelphia -- doesn't mean he won Pennsylvania.


For once, it's a state that I have practical personal experience with that is under discussion; and I know people in several smaller towns who are pretty pro-Obama, and report that this is the general sentiment of their towns. Not worried in the slightest.

Plz remember that NC polling was WAY off as well, showing him close to being tied.

Cycloptichorn
0 Replies
 
Cycloptichorn
 
  1  
Reply Mon 19 May, 2008 11:47 am
http://media.gallup.com/poll/graphs/051908DailyUpdateGraph1_plkjyf9.gif

His largest lead to date.


Cycloptichorn
0 Replies
 
sozobe
 
  1  
Reply Mon 19 May, 2008 11:51 am
Oh wow! That's good to see. I remember when I was hoping to see Obama break 51% -- now all the way up to 55%. Cool.
0 Replies
 
sozobe
 
  1  
Reply Mon 19 May, 2008 02:20 pm
Meanwhile, SUSA's latest polls are out -- Obama 55, Clinton 42 in Oregon. So that's better (and is SUSA, which has been pretty good -- I seem to remember they were off recently though, Indiana maybe?)

PPP: Obama 58%, Clinton 39%.

From the PPP analysis:

Quote:
"Obama has likely pretty much won the election already. Oregon votes by mail, and he is polling at 59% with the 74% of poll respondents who reported already having cast their ballots."


Hmm. We'll know soon enough.
0 Replies
 
nimh
 
  1  
Reply Mon 19 May, 2008 03:27 pm
Cycloptichorn wrote:
sozobe wrote:
That's Portland though. Remember that the largest one until then was in Philadelphia -- doesn't mean he won Pennsylvania.


For once, it's a state that I have practical personal experience with that is under discussion; and I know people in several smaller towns who are pretty pro-Obama, and report that this is the general sentiment of their towns. Not worried in the slightest.

FWIW, the last Survey USA poll has Obama doing equally well in the Portland Oregon and the rest of Oregon. He leads by 13 in Portland and 14 in the rest of the state.

***

Cycloptichorn wrote:
Plz remember that NC polling was WAY off as well, showing him close to being tied.

The fact that he's ahead in the polls now could offer some hope that he will actually outdo the polls... after all, look at how it's gone so far:

nimh wrote:
Winner/loser

Margin in the final results was at least 1% more favourable for the candidate who had been ahead than it had been in the last polls in 15 states

Margin in the final results was at least 1% more favourable for the candidate who had been behind than it had been in the last polls in 7 states

No significant difference between result and polling in 2 states.
0 Replies
 
nimh
 
  1  
Reply Mon 19 May, 2008 03:37 pm
sozobe wrote:
Meanwhile, SUSA's latest polls are out -- Obama 55, Clinton 42 in Oregon. So that's better (and is SUSA, which has been pretty good -- I seem to remember they were off recently though, Indiana maybe?)

Yeah, Indiana and North Carolina too. Both states they had Hillary doing a lot better than she ended up doing.

Bit of a pattern, actually. For example, there were those two Super Tuesday states where SUSA and Zogby were off at opposite ends: CA and MO. In California, SUSA said Hillary would have an ample lead, while Zogby had Obama up big; SUSA was right. In Missouri, SUSA had Hillary with an ample lead while Zogby had Obama in the lead; Zogby was right. Then later on in Ohio Zogby was wrong again, predicting a tie, while SUSA was proven right in its assessment of a big Hillary lead.

Tempting to take away that, hey, all these times SUSA had the more Hillary-friendly polling; just sometimes it was proven right, sometimes wrong. So, hmmm, if SUSA now has Obama ahead by that much now, then, that feels kinda good...
0 Replies
 
sozobe
 
  1  
Reply Mon 19 May, 2008 03:42 pm
OK, cool. Thanks for reminding me of where SUSA was off (and where they weren't).

OK, I'm less concerned. I just didn't like the juxtaposition of everyone (pundits et al) assuming an Obama win in Oregon, and pretty-close polling. Not least because voters seem to have tended to get annoyed with punditocratical assumptions.
0 Replies
 
nimh
 
  1  
Reply Mon 19 May, 2008 07:44 pm
sozobe wrote:
Whoa. That guy's... thorough.


One of the things I like most about those maps is the way the states outline themselves so clearly. I mean, that's weird, really, when you think about it. State borders are just arbitrary lines in the sand, mostly. Population patterns cross borders. Media markets cross borders. There's no immediately graspable rational reason why counties on one side of a state border would suddenly, collectively, have more Obama or Hillary supporters than those on the other side.

And yet there they are - especially in the West and Midwest, there's these sharp borders. Look at Kansas, or Illinois - cross the state border, and support for Obama is a factor higher:


http://farm3.static.flickr.com/2372/2483499455_c5b35f2ef1.jpg


In the South and on the Atlantic coast you dont see the state lines so much, because two cross-regional demographic swathes crush them all: the "black belt" roughly along the coasts all in Obama-blue, and on the inside of that, the Appalachians all in Hillary-red.

(I finally found out why Arkansas, Missouri - the Ozarks - and Oklahoma are considered a kind of Appalachian diaspora; apparently there was a long standing migration trend from the Appalachians out West that way.)

But in the Midwest and West - even though that's where the state borders were drawn arguably most randomly - the political mood or discourse apparently really plays out significantly on some state-specific level, contained by the state borders.

Look, the B/W maps show it more clearly still. This is the Obama map again:


http://farm3.static.flickr.com/2261/2478038542_d01fa78e8f.jpg


Now, it's only logical that Iowa is so much darker -- it was at the beginning of the campaign, Edwards still drew a lot of votes, it's a dark state for Hillary too. Same with NH vs Vermont up in New England. But look at Kansas! The sharp contrast between high Obama support within the state's borders with low Obama support right across the borders. Same with Illinois. Then look at Missouri in between, for the opposite effect.

Here, Clinton has her own clearly delineated state borders:


http://farm3.static.flickr.com/2040/2477226555_dbf0df7884.jpg


Arkansas - look at the Arkansas/Louisiana border. Missouri. Connecticut, darker than the surrounding states.

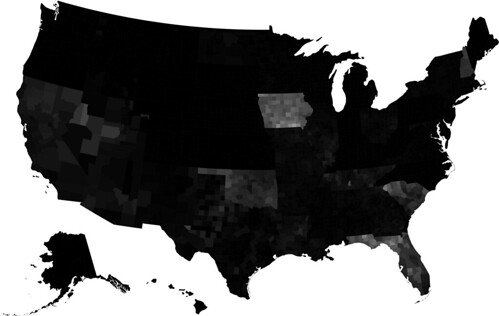
Here's Edwards again. That South Carolina, New Hampshire and Florida light up clearly is logical: that was when he was still in the race, so of course he still got more votes. But look at Oklahoma and Tennessee!

http://farm4.static.flickr.com/3112/2478037124_ab2b26cc06.jpg


That was after he got out of the race, on Super Tuesday - but he still got a lot of votes there, and for some reason his advantage neatly aligned with the state borders in both those states. Isnt that weird?

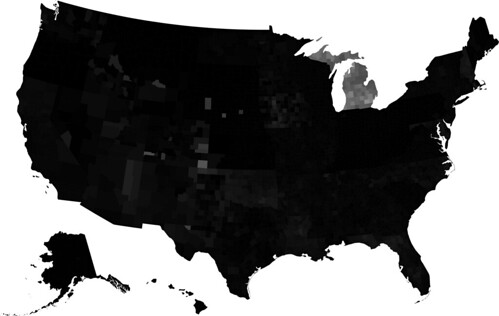
You even see a little bit of this with the other candidates (Richardson, Biden, Dodd, Kucinich etc). I didnt post that map cause it's so dark you have to kind of tilt your screen a little bit to make things out at all, but if you do you again see some states outlined - well, yeah, Michigan of course ("uncommitted") and the early states (IA, NH, FL, though not, interestingly, SC); but also Maryland (Biden?) and states with - I'm guessing - lots of conservative-minded white Dems who really didnt like either Clinton or Obama: Oklahoma, Louisiana, North Carolina:

http://farm4.static.flickr.com/3138/2478036522_1182c4f0dd.jpg
0 Replies
 
Roxxxanne
 
  1  
Reply Mon 19 May, 2008 10:13 pm
Hillary is off her meds again. Today, she cited a reprt by Karl Rove boslering her candidacy. She is merely to be pitied at this point.
0 Replies
 
sozobe
 
  1  
Reply Tue 20 May, 2008 11:57 am
Some nice Gallup analysis:

Quote:
The broadening of Obama's appeal for the nomination seen in Gallup's May 16-18 polling is fairly widespread, with the percentage favoring him increasing among most demographic categories of Democratic voters. However, as a result, certain groups that were already highly supportive of Obama for the nomination -- men, 18- to 29-year-olds, postgrads, and upper-income Democrats -- are now overwhelmingly in his camp. Obama is currently favored among these groups by a 2-to-1 margin, or better, over Clinton.


http://media.gallup.com/poll/graphs/080520Obama2_hf48rua.gif

Quote:
At the same time, support for Clinton among some of her traditionally stalwart support groups -- women, Easterners, whites, adults with no college education, and Hispanics -- has fallen below 50%.


http://media.gallup.com/poll/graphs/080520Obama3_naoiur3s.gif

Quote:
The only major demographic group still supporting Clinton to the tune of 51% or more is women aged 50 and older. This group's preferences have changed little during May, at the same time that Clinton's support among younger men (those 18 to 49) has declined by nearly 10 points.


http://media.gallup.com/poll/graphs/080520Obama4_n23dkfd.gif

Overall:

http://media.gallup.com/poll/graphs/080520Obama1_maoe9ldjf.gif

http://www.gallup.com/poll/107407/Obama-Surge-Fairly-BroadBased.aspx
0 Replies
 
JPB
 
  1  
Reply Tue 20 May, 2008 12:46 pm
nimh, re your state delineation lines above for IL and KS being strongly for obama -- those could simply reflect native son attitudes towards 'one of their own'.
0 Replies
 
nimh
 
  1  
Reply Tue 20 May, 2008 01:41 pm
Quote:


Two weeks ago, a post in the numbercrunching Behind the Numbers blog of the WaPo delved into that much-discussed subject of "Limbaugh Democrats". Was there a massive number of Republicans crossing over to vote for Hillary in the Democratic primary just to prolong the race and cause mayhem?

Some of the data from the exit poll certainly suggested so, as this post recalls:


Quote:
Republicans made up 10 percent of all Democratic voters in Indiana last night, their highest share of the electorate in any Democratic primary this year other than Mississippi. Not only did Clinton win Republicans in Indiana by eight percentage points, but about six in 10 of those who supported her in the primary said they would vote for McCain over Clinton in a hypothetical general election match-up. (Most Republicans voting for Obama said they would stick with him in the fall.)


But the point of this post is to question the conclusion that this means that most of those Republican Clinton voters were just making trouble. What if their vote was a sincere one, even within the context of still preferring McCain over either Democrat?


Quote:
A closer look, however, reveals that most Republicans for Clinton appear to genuinely prefer Clinton to Obama, which was the choice at hand. They opted to vote in one of the hottest elections in years, perhaps with an eye to giving themselves more appealing options in the fall.

About nine in 10 GOP Clinton voters said she would make a better commander in chief, and more than six in 10 said she would have a better shot at beating McCain. They were also more than twice as likely as other voters to prioritize an experienced candidate. And three-quarters of these voters said they would be satisfied with Clinton atop the Dem ticket, just 15 percent said so about Obama.

A narrow majority of Clinton Republicans did say that Clinton does not share their values, but more said so of Obama. All politics is comparative.


Moreover, the post reminds us, the actual impact this Republican cross-over vote for Clinton had was negligeable if not nil:


Quote:
First, Clinton edged Obama in Indiana's open primary among self-identified Democrats, 52 to 48 percent. And removing all GOP-identifiers from the voter pool does not budge the overall result. Perhaps the focus on non-Democrats is misplaced. [..]

And looking at the Indiana exit poll numbers by race also seems to dampen any "Limbaugh effect." Overall, Clinton won the state's white voters by 20 percentage points. Republicans, 95 percent of those who voted Democratic yesterday were white, broke for her by eight points, but that was much narrower than her win among white Democrats: she outpaced Obama by nearly 2-1 among those voters.


A respondent, however, in turn dampens any analysis of the "Limbaugh effect", regardless of what conclusions it reaches:


Quote:
It seems silly to me to look at exit polling data to decide whether or not Republicans are gaming the system to their advantage. There isn't anything to make them more likely to tell the truth to a pollster than on their party preference form.
0 Replies
 
nimh
 
  1  
Reply Tue 20 May, 2008 02:01 pm
JPB wrote:
nimh, re your state delineation lines above for IL and KS being strongly for obama -- those could simply reflect native son attitudes towards 'one of their own'.

We were having a little discussion about that in the Obama thread re Kansas... :wink:

Still, pretty amazing that there's such a strong state-level identity (still), apparently, where whether you live on one side of a state border or the other can apparently heavily influence your political sympathies... with so much internal migration, and cross-state media markets, and many of these borders having been drawn rather arbitrarily in the first place, and there being such a strong unitary American national identity, I was intrigued by that, hadnt really expected it (anymore).

Even though Joe from Chicago was right to throw some water on the idea... I guess there is all that.

It's probably more a question of a few exceptions where there is a clear state effect of some sort, while on the rest of the map any 'recognition' of the division by states is something of an optical illusion..

Interesting, when I look again, that those exceptions seem to kind of be contiguous - I mean, if you disregard the early states whose results stand out because the field of contenders looked differently at the time. Then you're (arguably) left with KS (Obama), OK (Edwards), MO and AR (Clinton), IL (Obama), TN (Edwards), and maybe NC...)
0 Replies
 
nimh
 
  1  
Reply Tue 20 May, 2008 02:11 pm
The Democratic primaries 2008 - the Unrelenting Reign of Demography

We've talked a lot here about the performance of the various pollsters throughout the primary season, when their estimates ended up more or (often) less in line with the actual results.

What nobody here, I think, has mentioned yet is the phenomenon that is FiveThirtyEight.com, where a blogger writing under the pseudonym Poblano has been doing yeoman's work in terms of painstakingly mapping the races, analysing demographics, tracking polls -- and eventually, predicting outcomes.

I saw ever more links to that site pop up as the primary season progressed. But I have to admit that by the time it became universally praised, I was kind of rooted in the websites that I already always visited, and which took way to much time to read already, so I never really took much of a look. But apparently, the site is brilliant.

More than ever, Poblano was vindicated by the Indiana and North Carolina primaries. In this column, Pollster.com's Mark Blumenthal shows how Poblano's models outperformed all the opinion polls.

But there is a larger story behind this guy's success. His models are all based on demographic data and trends. And his vindication, in the end, is primarily an illustration of how demography has ruled the outcomes of these primaries, practically throughout the season, with an iron fist. In a way that no previous primary was determined so.. well, deterministically.

Campaign memes pushed strenuously by Camp Obama or Camp Hillary came and went. The media's freakshow hypes came and went. NAFTA, Wright, the health insurance debate, Bittergate, Tuzla -- passed by. And, as has been emphasized before, with barely a flicker of an effect, once you calculated in the demographic differences from state to state. (See for example how Prof. Sides observed the (lack) of development between the Ohio and Pennsylvania primaries.)

Blumenthal lays out some of the numbers:

Quote:
MYSTERY POLLSTER
The Poblano Model

National Journal
May 8, 2008

Over the last week, an anonymous blogger who writes under the pseudonym Poblano did something bold on his blog, FiveThirtyEight.com. He posted predictions for the upcoming primaries based not on polling data, but on a statistical model driven mostly by demographic and past vote data. His model predicted a 17-point victory for Barack Obama in North Carolina and a 2-point edge for Hillary Rodham Clinton in Indiana.

Critics scoffed. Most of the public polls pointed to a close race in North Carolina. Looking back at Poblano's efforts in Pennsylvania, pollster Dick Bennett decried the models as "stepwise regression run amok." Slate's Mickey Kaus predicted failure for "a sophisticated model that ignores... what's been happening in the campaign. Like Rev. [Jeremiah] Wright."

But a funny thing happened. The model got it right.

Obama carried North Carolina by 14 percentage points (56 percent to 42 percent) and Clinton prevailed in Indiana by exactly the 2-point margin Poblano predicted (51 percent to 49 percent). Moreover, the predictions were more accurate than any of the pollsters' results, as indicated by the graphic below (modified from a chart created by Brian Schaffner of the Center for Congressional and Presidential Studies). The model was certainly closer to the final result than our Pollster.com trend estimates based on all of the available public polling data (we had Clinton leading by 4 points in Indiana and Obama up by 7 in North Carolina).


http://www.nationaljournal.com/njonline/mp_20080507_8254_image_0.jpg


I also asked SurveyUSA's Jay Leve how the model would have ranked on the scorecards he created to rate pollster accuracy in Indiana and North Carolina. Had it been a poll, Poblano's model would have been the top ranking "pollster" on 13 of 16 accuracy benchmarks applied in the two states.

How could that be?

When a statistical model succeeds in this way, it is usually because the it manages to quantify reality in some important way. In this case, the fundamental insight captured by Poblano's model is the remarkable consistency of vote preference in the Obama-Clinton race among key demographic subgroups.

Over the course of the primary season, especially since early February, the preferences of Democratic primary voters have been mostly stable. As my colleague Ronald Brownstein put it last week, Clinton has consistently prevailed among a "beer track" coalition of blue-collar whites, Latinos and seniors. Obama consistently dominates Clinton among blacks and younger white voters, and he draws additional strength from a "wine track" coalition of independents and well-educated white voters. What varies from primary to primary is less about the shifting allegiances of voters within these groups and more about differences in the demographic composition of each state.

Consider some specific examples. The outcome of the North Carolina primary was wildly different than Ohio or Pennsylvania, yet non-college white voters favored Clinton by virtually identical margins in each state (+44 in Ohio, +41 in Pennsylvania, and +45 in North Carolina, according to the Edison/Mitofsky National Election Pool exit polls provided by NBC and ABC News). Clinton's margin was far narrower among college-educated whites in each state (+7 in Ohio, +10 in Pennsylvania and +7 in North Carolina). And Obama won near monolithic support from blacks in all three states (87 percent in Ohio, 90 percent in Pennsylvania, 91 percent in North Carolina).

The different overall outcomes owed mostly to the varying demographic composition of each state. Blacks and college-educated whites made up roughly two-thirds of the North Carolina electorate, but only about half of the voters in Ohio and Pennsylvania.

Poblano's model succeeded because it captured the demographic coalitions in evidence from previous primaries and applied them forward to Indiana and North Carolina.

All of which brings us to the underlying story of the Democratic presidential primaries. Since Super Tuesday, it has mostly been the story of what hasn't happened. Over the last three months or so, for better or worse, the underlying coalitions of support for Obama and Clinton have remained largely constant.

So therein lies the bad news and the worse news for the Obama and Clinton campaigns, respectively. The bad news for the Obama campaign is that evidence of an expansion of his coalition is weak.

The far worse news for the Clinton campaign is that evidence that she made "important progress" among white voters in Indiana and North Carolina is weaker still. After weeks of pummeling over the controversies involving the Wright's remarks and Obama's comments about the "bitterness" of rural voters, Obama's coalition remains intact and on track to produce a majority of pledged delegates. The "game-changer" that the Clinton campaign counted on to alter the thinking of unpledged superdelegates did not materialize.
0 Replies
 
sozobe
 
  1  
Reply Tue 20 May, 2008 02:16 pm
Yep, Poblano has been coming up more and more -- I was just there earlier today, got a bit overwhelmed by the sheer amount of info, though.

Good news is, this is already out of date:

Quote:
The bad news for the Obama campaign is that evidence of an expansion of his coalition is weak.


(See Gallup info on previous page.)
0 Replies
 
nimh
 
  1  
Reply Tue 20 May, 2008 02:21 pm
nimh wrote:
More than ever, Poblano was vindicated by the Indiana and North Carolina primaries. In this column, Pollster.com's Mark Blumenthal shows how Poblano's models outperformed all the opinion polls.

Might be interesting, in that context, to note what Poblano is projecting for today:

Oregon: "Obama by 13.8 points [and 6 delegates], and turnout of 661,470."

That's from the site's revised estimate; but for the full (and very exhaustive Shocked ) analysis of the state by congressional district see the original thread from yesterday.

Kentucky: is analysed in equally exhaustive region-by-region detail, but the conclusion is less firm:

Quote:
In the previous five states where I released projections, I felt pretty darn comfortable with them. [..] But this projection in Kentucky -- I'm not so certain about. [..]

Our model is projecting a 19-point popular vote win for Clinton, with about 7 percent of the vote going to Edwards and uncommitted. That would be worth a net gain of about 95,000 popular votes for her, which would closely match Obama's projected margin in Oregon. [..]

Can Obama actually keep the popular vote margin within 20? I still wouldn't bet on it [..]. I can see Obama keeping things within 25 points, but 20 seems like a stretch.
0 Replies
 
sozobe
 
  1  
Reply Tue 20 May, 2008 02:30 pm
nimh wrote:
(and very exhaustive Shocked )


'zactly.

Thanks for the predictions though, my eyes had glazed over to the point that I didn't see the KY stuff.

This is the link I followed earlier, only OR stuff.)

Less than 20 pts in KY would rock...
0 Replies
 
nimh
 
  1  
Reply Tue 20 May, 2008 02:30 pm
sozobe wrote:
Yep, Poblano has been coming up more and more -- I was just there earlier today, got a bit overwhelmed by the sheer amount of info, though.

Yep, me too... Shocked

Fascinating, but a bit overwhelming.

sozobe wrote:
Good news is, this is already out of date:

Quote:
The bad news for the Obama campaign is that evidence of an expansion of his coalition is weak.


(See Gallup info on previous page.)

Hhmmmmmm.

I wouldnt be so quick to dismiss an analysis that's based on the full season of actual primary results, on the ground of an analysis that's based on three days' worth of data of one opinion pollster's tracking poll.

Especially since Gallup's finding of a clearly expanding Obama lead/coalition is contrasted by the rival tracking poll (Rasmussen's) finding no such thing. Today Rasmussen finally has Obama up 4 points again, but in the last three days it had Obama's lead back down to just 2%.
0 Replies
 
sozobe
 
  1  
Reply Tue 20 May, 2008 02:39 pm
OK, that's true -- one Gallup poll does not a case make.

A more accurate statement is -- what you quote is from May 8th, and a lot has happened since then. Especially, Obama has eased further into the presumed nominee slot. I think that will do more to broaden his coalition than anything else -- and one piece of evidence seems to support that idea (the new Gallup poll).
0 Replies
 
sozobe
 
  1  
Reply Tue 20 May, 2008 02:54 pm
I was nosing around on Rasmussen and found this:

Quote:
A separate survey found slightly different results when third-party candidates were mentioned by name. In a four-way race, Obama earns 42% of the vote, McCain 38%, Bob Barr 6% and Ralph Nader 4%. Given those options, 11% were undecided. Barr and Nader were mentioned as candidates of the Libertarian Party and the Green Party respectively.


It has lots of disclaimers and generally doesn't mean much on its own but that's something I've been curious about (impact of third-party candidates, especially Barr).
0 Replies


Related Topics

 
Copyright © 2024 MadLab, LLC :: Terms of Service :: Privacy Policy :: Page generated in 0.12 seconds on 11/25/2024 at 06:43:23