@Ionus,
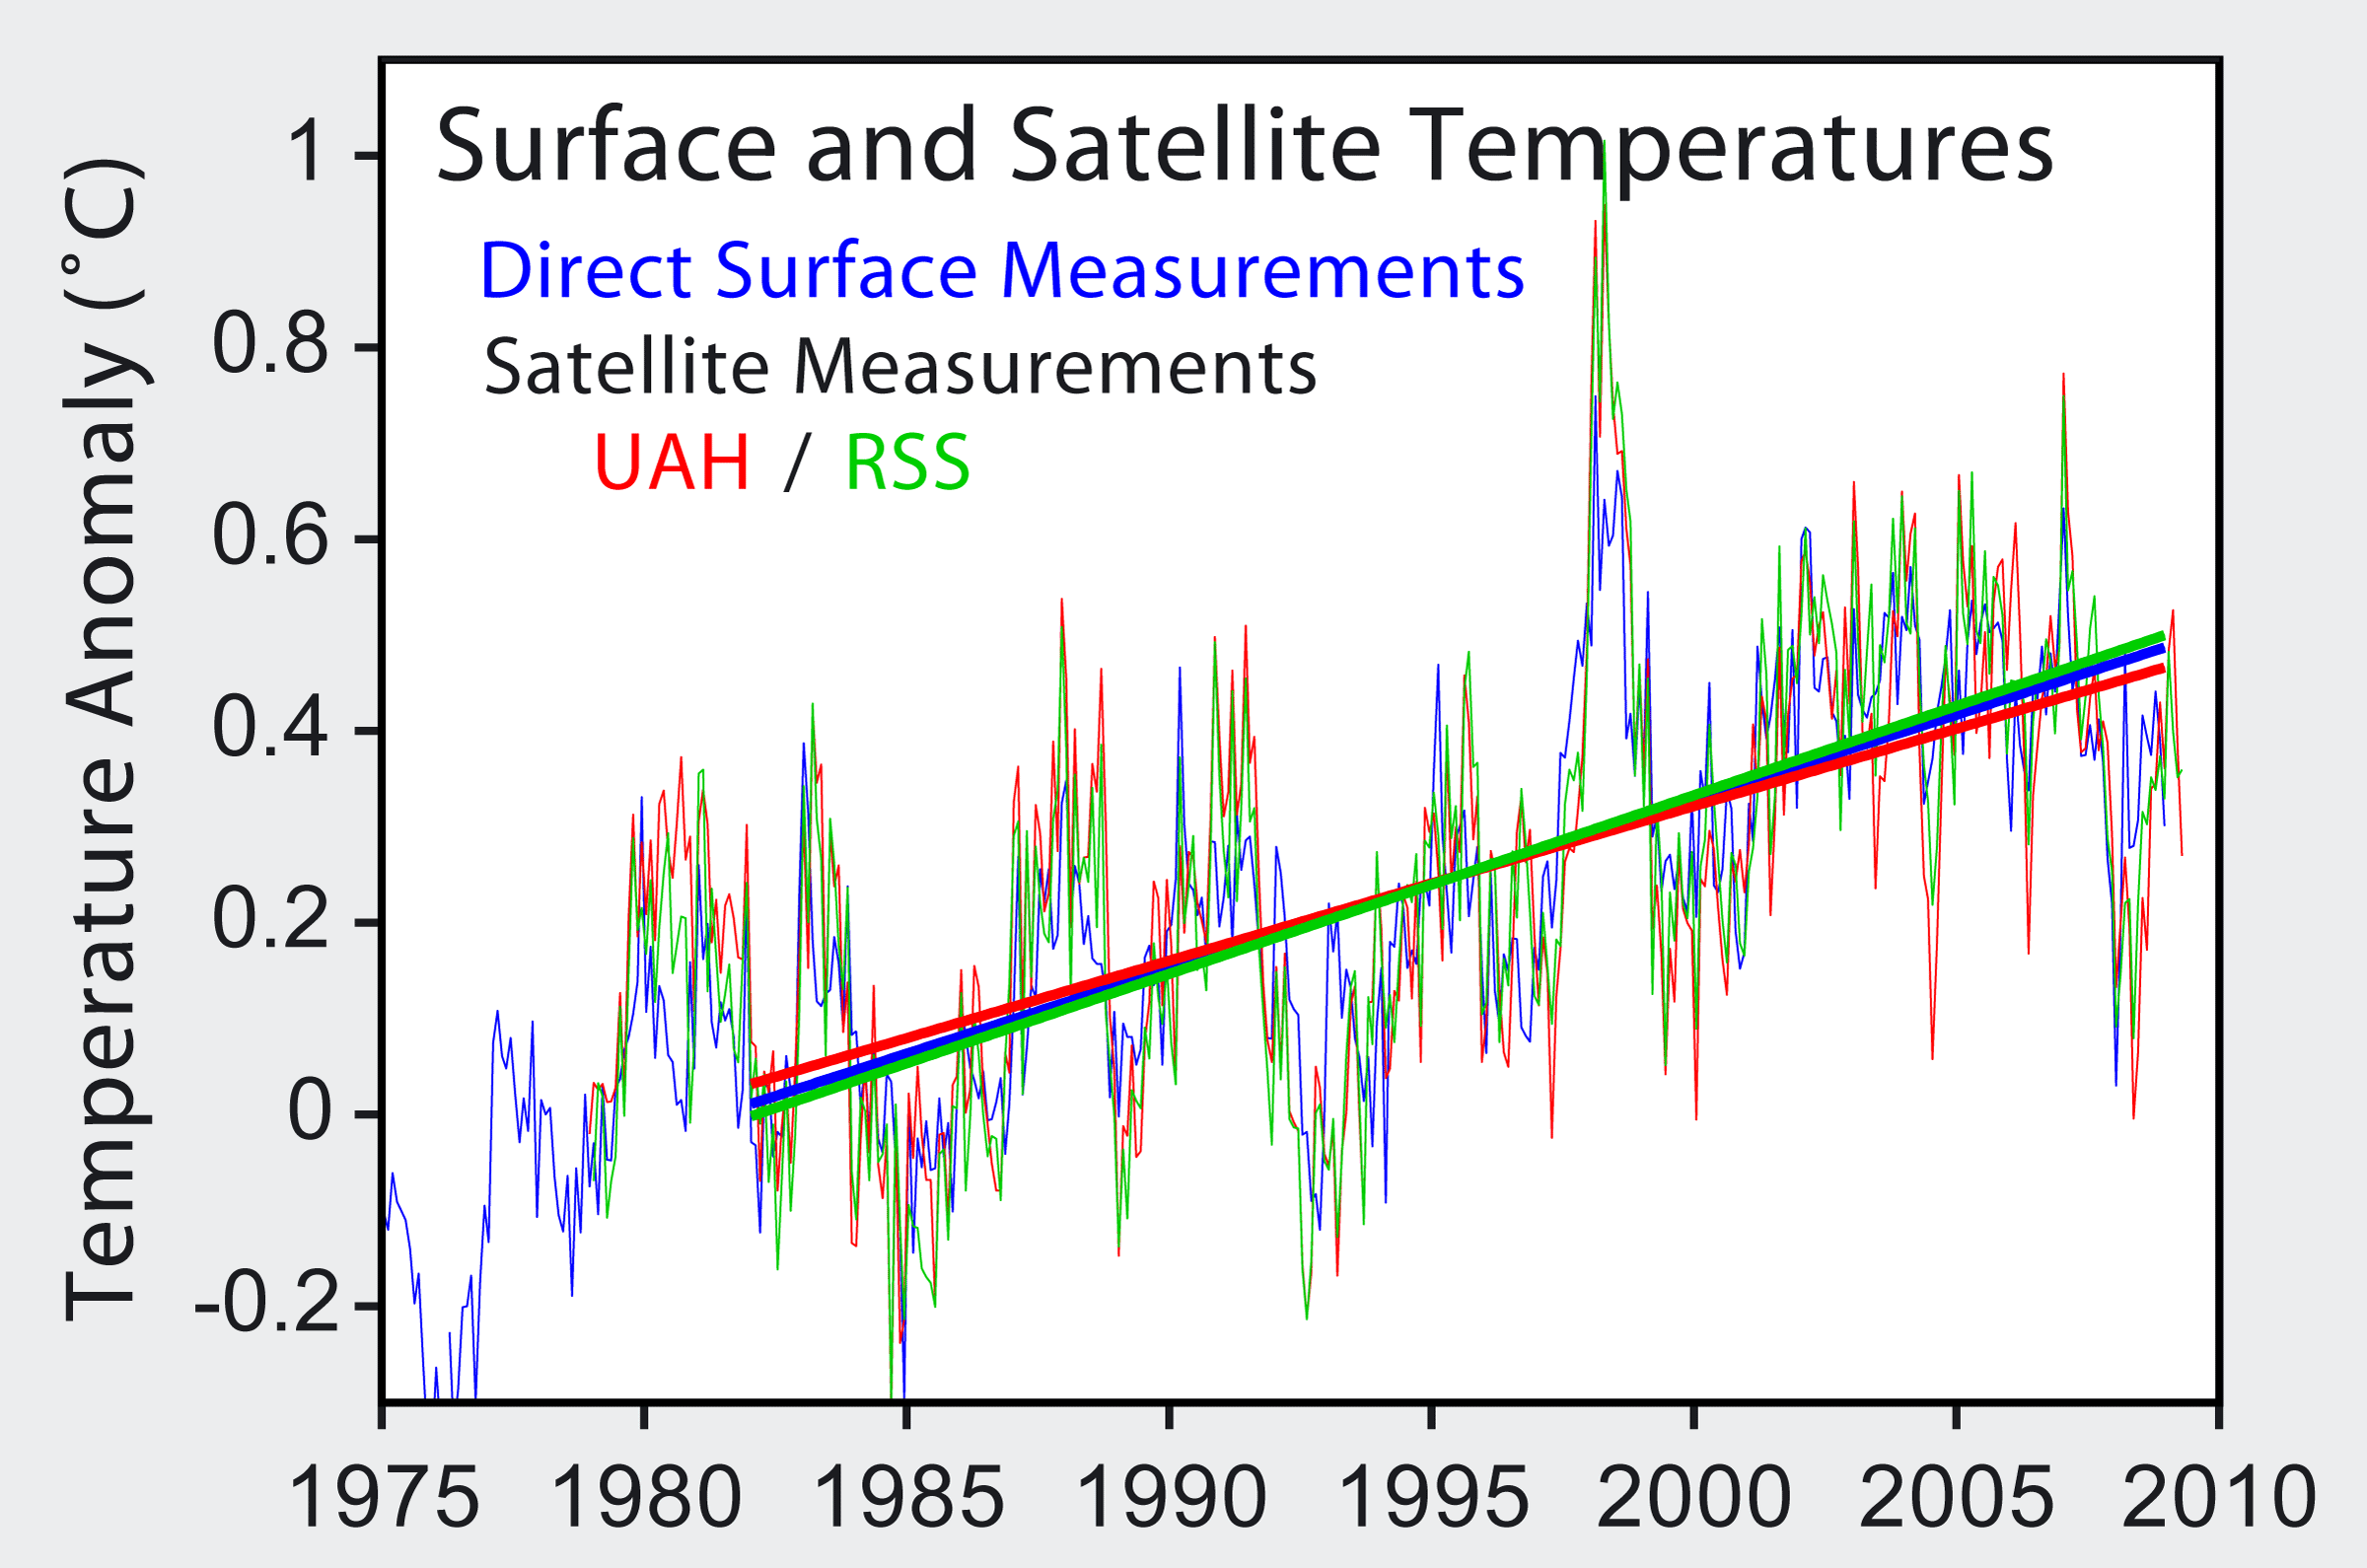
In order: because they all have access to all the datasets, the satellite temp records of land, sea, and the atmosphere, and the climate simulations and the algorithms involved, and they all have eyeballs, and can see the macro changes that we all can see.
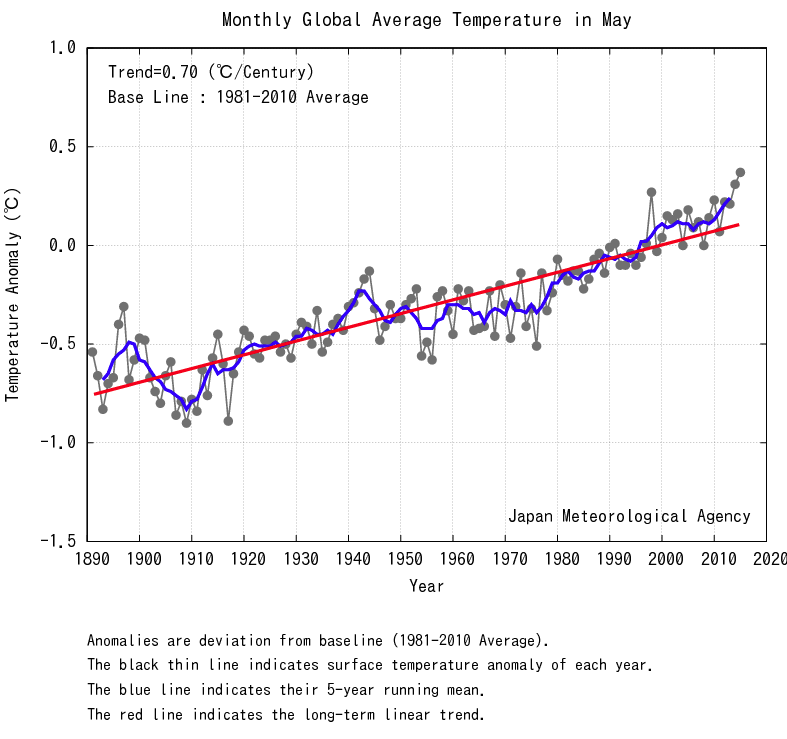
It might be a reasonable assumption if the graph were titled something like "Temps of Japanese cities in May in the hoistorical record". Since it is in fact titled Global Average temperature, it is more reasonable to conclude it's agout global average temperature.
No, cities are generating more heat than they used to, because of many factors, use of fossil fuels for heating and air conditioning and consturction, industrialization, higher albedos (the highest recorded natural temp according to NASA is 159F in the Lut desert in Iran (or maybe Iraq), the highest urban temp is over 180 on tar rooftops in NYC). It is as Walter says the Urban Heat Island Effect, and it has already been discussed in great detail here. Where were you then? It is possible, indeed easy with computers, to separate urban temps from non-peopled sites and compare them, and both show the same warming trends. And temps are NOT measured only where people are--your data are flat wrong. The US Weather Service has had as many as 6000 sites they drew data from, and similar numbers of sites around the world, in all climate zones, over the last two hundred years or so, now, plus ocean surface temps from virtually everywhere, because ships went everywhere for three centuries or so, plus satellites have been measuring ocean temps since the 60s, and land temps since the 70s, and their orbits cover most of the earth over several orbits, plus ARGUS measuring deeper ocean temps and popping back up regularly. You seriously underestimate the number of observations made and the length of time involved.