72
   

Global Warming...New Report...and it ain't happy news


ican711nm
 
  1  
Reply Wed 4 Aug, 2010 08:15 pm
@parados,
Parados, I'll post the temperature graphic regardless of its trend. The questions to be answered are:
(1) what caused the temperature trend over the last 100 years; and,
(2) what caused the temperature trend--whatever it is--after 2010?
Ionus
 
  1  
Reply Thu 5 Aug, 2010 12:05 am
@spendius,
Quote:
That's because those who set intelligence tests know these things themselves and have a reputation riding on the back of them.
You are referring to someone from the factory...have you been a bad machine ?
0 Replies
 
parados
 
  0  
Reply Thu 5 Aug, 2010 06:48 am
@ican711nm,
1. It can't all be from the sun because the solar increases haven't been enough.

2. a. Decrease in solar activity but if it was just that it would be much cooler since the solar activity is near an all time low for the last 100 years. b. Ocean currents are in the cooling part of their cycle.

Now.. why don't you tell us what caused the trend over the last 100 years?
ican711nm
 
  2  
Reply Thu 5 Aug, 2010 10:18 am
@parados,
parados wrote:
1. It can't all be from the sun because the solar increases haven't been enough.

2. a. Decrease in solar activity but if it was just that it would be much cooler since the solar activity is near an all time low for the last 100 years. b. Ocean currents are in the cooling part of their cycle.

Now.. why don't you tell us what caused the trend over the last 100 years?

Why don't you, parados, tell us what caused the average annual global temperarure trend over the last 100 years and provide your evidence? I don't know for sure and apparently no one else knows for sure.

What's your evidence?
(1) "solar increases haven't been enough."
(2) "decrease in solar activity ... would [MAKE IT} much cooler since the solar activity is near an all time low for the last 100 years."
(3) "ocean currents are in the cooling part of their cycle."
parados
 
  3  
Reply Thu 5 Aug, 2010 10:57 am
@ican711nm,
http://www.skepticalscience.com/images/Temp_vs_TSI_2009.gif

parados
 
  1  
Reply Thu 5 Aug, 2010 11:03 am
@ican711nm,
Quote:
(3) "ocean currents are in the cooling part of their cycle."


http://www.esrl.noaa.gov/psd/map/clim/sst_olr/sst_anim.shtml
0 Replies
 
parados
 
  1  
Reply Thu 5 Aug, 2010 11:05 am
@ican711nm,
Quote:
Why don't you, parados, tell us what caused the average annual global temperarure trend over the last 100 years and provide your evidence? I don't know for sure and apparently no one else knows for sure.

Does that mean you are willing to accept that it COULD be human caused?

Or does "I don't know" only mean you won't accept anything you don't believe politically?
ican711nm
 
  2  
Reply Fri 6 Aug, 2010 02:14 pm
@parados,
"That" means: I want to see your evidence of other causes in addition to the sun that caused the average annual global temperarure trend over the last 100 years, and in the last ten years.

While I do not know for sure what the true cause(s) are, I have many times previously stated what I think are probably the main causes of the average annual global temperarure trends over the last 100 years, and in the last ten years, and why I think so.
parados
 
  0  
Reply Fri 6 Aug, 2010 03:41 pm
@ican711nm,
I guess it would mean this one..

Quote:
Or does "I don't know" only mean you won't accept anything you don't believe politically?
ican711nm
 
  1  
Reply Fri 6 Aug, 2010 04:59 pm
@parados,
parados wrote:
I guess it would mean this one..

... "I don't know" only mean you won't accept anything you don't believe politically

Why do you guess that?
Ionus
 
  1  
Reply Mon 9 Aug, 2010 12:32 am
@parados,
Quote:
why don't you tell us what caused the trend over the last 100 years?
Why dont you tell us how a self correcting systen becomes unbalanced when it has the smallest input due to a single cause ever in the earth's history... large volcanoes do worse...melting soils from a previous Glacial Advance do worse...a meteorite does worse...yet we are facing doom....Why dont you tell us why a miniscule trend like a 100 years is significant and which 100 yr trend are you comparing it to, because all I see is the 100 years being compared to itself...so you really mean several 10 yr trends are being compared.
0 Replies
 
Ionus
 
  1  
Reply Mon 9 Aug, 2010 12:33 am
@ican711nm,
Quote:
Why do you guess that?
Dont seat it ican..he is prone to guesses. Global Warming is a guess.
0 Replies
 
High Seas
 
  1  
Reply Mon 9 Aug, 2010 02:20 am
@Ionus,
Ionus wrote:

Quote:
My God High Seas..
High Seas is intelligent but that is overdoing it even for your fondness of exageration.
Quote:
Where are your peer reviewed papers on this?
Do you doubt the figures ?
Quote:
I'm sure you must have written them since you understand the science better than anyone else.
You mean anyone understands the science better than you.

That's funny - but the really funny part is that there actually was a link to a "peer-reviewed paper" posted along with an excerpt. Parados managed to miss both while disagreeing with my post, presumably on general principle. It's kind of hopeless trying to explain anything to someone who can't read - or won't. Since the page turned, here's a link to the original post: http://able2know.org/topic/44061-807#post-4305401 Thanks all the same Smile
parados
 
  0  
Reply Mon 9 Aug, 2010 06:53 am
@High Seas,
What's funny is what you consider a peer reviewed paper High Seas.


From your link to a "peer reviewed paper".
Quote:
This is an essay professor Richard Lindzen of MIT sent to the Free Lance-Star in Fredericksburg, Va for their Opinion Page in March,


I didn't realize that essays printed in the Free Lance-Star's opinion section counted as 'peer reviewed science'.
0 Replies
 
ican711nm
 
  1  
Reply Mon 9 Aug, 2010 11:39 am
http://www.cru.uea.ac.uk/cru/data/temperature/nhshgl.gif

http://www.cru.uea.ac.uk/cru/data/temperature/nhshgl.gif
Average Annual Global Temperature 1850-2010.
During the 100 year period, 1910 to 2010, the average annual global temperature increased less than 1°C (1.8°F).

Notice that the average annual global temperatures prior to 1910 were higher than they were in 1910.

Why did the average annual global temperatures decrease prior to 1910?
High Seas
 
  1  
Reply Mon 9 Aug, 2010 01:40 pm
@ican711nm,
Here's an even more impressive chart - first graph is actual observed correlation, all other charts are projected correlations based on any "climate model" likely to find favor with religious fanatics, marxists, global warmists (sorry btw Parados but I finally had to put you on ignore):
http://www.masterresource.org/wp-content/uploads/2009/08/clip_image001_thumb1.jpg
Quote:
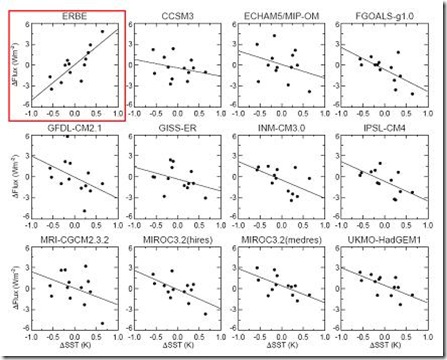
Figure 1. The observed relationship between ocean temperature changes (x-axis) and radiation flux to space (y-axis) is contained in the graph with the red box around it. The other graphs depict the relationship as predicted by 11 different climate models (adapted from Lindzen and Choi, 2009).

http://www.masterresource.org/2009/08/climate-sensitivity-estimates-heading-down-way-down-richard-lindzen/
parados
 
  1  
Reply Mon 9 Aug, 2010 01:56 pm
@High Seas,
Quote:
sorry btw Parados but I finally had to put you on ignore


That's understandable after you attacked me for not accepting your opinion piece as "peer reviewed science." When you make a mistake, it is so much easier to just ignore those that point it out. It doesn't make for good science, but then that isn't why you are here I guess.
parados
 
  0  
Reply Mon 9 Aug, 2010 02:10 pm
@High Seas,
You didn't bother to read the comments after the article, (which is not a peer reviewed piece.) The peer reviewed piece that this predates has this as the final comment after several errors were pointed out in the charts you posted High Seas.

Quote:
[RLB: The paper, according to Lindzen, has been revised and returned to JGR."]
0 Replies
 
High Seas
 
  2  
Reply Mon 9 Aug, 2010 02:23 pm
@spendius,
Thanks to you as well for the kind comments. I'm going to put the entire thread on ignore - there really is no more to add to the utter demolition of the original IPCC boondoggle. The entire subject is a complete waste of time, not just Parados with his residual fanatic's posts. See you all around.
MontereyJack
 
  0  
Reply Mon 9 Aug, 2010 03:59 pm
Go right ahead and put the thread on ignore, High Seas. The world will just go on warming without you, as the recent report to NOAA on the state of the climate from 200 scientists around the world made clear. If you want to bury your head in the sand, feel free (just watch out--that sand is getting really hot). By the way, have you noticed what the year bar on the right hand end of those graphs that ican keeps posting is doing?
 

Related Topics

 
Copyright © 2025 MadLab, LLC :: Terms of Service :: Privacy Policy :: Page generated in 0.1 seconds on 02/07/2025 at 06:48:17