oh all right, since you're apparently too lazy to scroll back a couple pages here it is again. I've been trying to avoid the increasing instances here or reposting the same old crap, which seems to be the main leitmotif of one poster here, but apparently I can't.
 http://www.pmodwrc.ch/pmod.php?topic=tsi/composite/SolarConstant
Note that they incorporate the ACRIM data. Note their reconciliations of the data.
You might be interested in their next graph, which backcomputes the 1975 minimum (pre sensor). TSI also decreases from that.
The IPCC and Tamino are dubious about ACRIM as it stands because most of the difference in interpretation comes from the ACRIM interpolation of one anomalous reading from another satellite during the gap between ACRIM satellites, which other observations from the time don't pick up.
Note also, if you're going to use Tamino, that ACRIM is converging on the point of no increase over time. Note further that Tamino says even if there were an upward trend in TSI its effect would be comparable to the effect on temperature of human power generation, which is just a fraction of the total human effect.
Well, of course it did.
Quote:The House Oversight and Government Reform Committee recently reported that EPA staff members had determined in December that the emissions endanger public health, but the process stalled after the EPA forwarded the findings to the White House.
http://www.washingtonpost.com/wp-dyn/content/article/2008/04/02/AR2008040201382.html?hpid=sec-nation
In any contest between public health (or public information) and corporate profits, this WH does the "let them eat cake" thing.
Walter Hinteler wrote:Quote:"We started on this game because of Svensmark's work," said Terry Sloan from Lancaster University.
"If he is right, then we are going down the wrong path of taking all these expensive measures to cut carbon emissions; if he is right, we could carry on with carbon emissions as normal."
The Svensmark hypothesis is that when the solar wind is weak, more cosmic rays penetrate to Earth.
'No Sun link' to climate change
Hi walter
I just bumped into that BBC piece as well. Here's a bit more from it.
Quote:The Intergovernmental Panel on Climate Change (IPCC), in its vast assessment of climate science last year, concluded that since temperatures began rising rapidly in the 1970s, the contribution of humankind's greenhouse gas emissions has outweighed that of solar variability by a factor of about 13 to one.
According to Terry Sloan, the message coming from his research is simple.
"We tried to corroborate Svensmark's hypothesis, but we could not; as far as we can see, he has no reason to challenge the IPCC - the IPCC has got it right.
"So we had better carry on trying to cut carbon emissions."
You mean that science has disproved okie and ican's argument?
WOW.. I bet that means ican will only post his graphs about a million more times while still never providing one source for his claimed increase measurement.
Not one scientist but 5? Oh.. I guess Foxfyre can still rest easy with the knowledge that ican is almost always right because okie agrees with him.
The way I read the story, it only relates to how the sun's cosmic rays may exaggerate the sun's effect upon climate by increasing cloud cover, etc., but it does not relate to the direct effect, which obviously does exist and has been proven. On top of that, the Lancaster research only covers a very short span of time, not enough to prove anything in my opinion, and the research has been questioned by others, namely Henrik Svensmark at the Danish National Space Center (DNSC), that came up with the cosmic ray link to cloud cover.
Most importantly, if I read it right, the BBC headline is wrong to begin with, the research has nothing to do with the direct solar link to the climate, but instead it has to do with the cosmic ray link to clouds. The headline and sub-headline are total embarrassments to journalism.
Further, there is an admission that cosmic rays may have at least a weak correlation to cloud cover, so while the headline claims no link, the research may actually be confirming the link. The disagreement is in the amplitude of the effect.
Having problems reading today okie?
The sun's radiation acts as a block for cosmic radiation. So the cosmic radiation varies based on solar activity which was the whole point of Svensmark's hypothesis about cosmic radiation reducing temperature.
If Svensmark was correct then we would have reduced solar activity AND more cloud cover at the same time which would mean even more of a response to the temperature when the sun goes into a low point in its cycle.
But as we all know with the sun presently in a slow cycle we don't have any cooling to speak of, let alone cooling doubled by an increase in cloud cover.
I note nothing of the kind.
From your link,
http://www.pmodwrc.ch/pmod.php?topic=tsi/composite/SolarConstant ,
with extra spacing introduced to aid clarity:
Quote:Figure 1.
Upper panel:
Compared are daily averaged values of the Sun's total irradiance TSI from radiometers on different space platforms since November 1978: HF on Nimbus7, ACRIM I onSMM, ERBE on ERBS, ACRIM II on UARS, VIRGO on SOHO, and ACRIM III on ACRIM-Sat. The data are plotted as published by the corresponding instrument teams. Note that only the results from the three ACRIMs and VIRGO radiometers have inflight corrections for degradation.
Lower Panels:
The PMOD, ACRIM and IRMB composite TSI as daily values plotted in different colors to indicate where the data are comming from. PDF Figure
Figure 1 covers 1978 - 2007, and is divided into 4 sections: a) Original Data, b) PMOD Composite, c) ACRIM Composite, and d) IRMB Composite. You neglected to describe or post the ACRIM Composite which shows an increasing TSI trend.
Yes, the ACRIM Composite shows an
increasing TSI trend.
parados wrote:You mean that science has disproved okie and ican's argument?
...
Blatham may mean that, but science
has not disproved the argument that increasing TSI is the primary cause of global warming since 1975. The UN IPCC merely represents the declared opinion of some scientists, but certainly not the declared opinion of a
consensus of
this world's scientists, like the UN IPCC fraudulently declared.
parados wrote:
...
The sun's radiation acts as a block for cosmic radiation. So the cosmic radiation varies based on solar activity which was the whole point of Svensmark's hypothesis about cosmic radiation reducing temperature.
If Svensmark was correct then we would have reduced solar activity AND more cloud cover at the same time which would mean even more of a response to the temperature when the sun goes into a low point in its cycle.
But as we all know with the sun presently in a slow cycle we don't have any cooling to speak of, let alone cooling doubled by an increase in cloud cover.
What scientific sources support your claims here and what are the links to those claims?
ican711nm wrote:parados wrote:You mean that science has disproved okie and ican's argument?
...
Blatham may mean that, but science
has not disproved the argument that increasing TSI is the primary cause of global warming since 1975. The UN IPCC merely represents the declared opinion of some scientists, but certainly not the declared opinion of a
consensus of
this world's scientists, like the UN IPCC fraudulently declared.
The UN IPCC represents the opinion of the majority of scientists working in the fields associated with its report.
"consensus" doesn't mean "all" no matter how many times you try to change it's meaning ican.
In a consensus opinion it would be unlikely that all would agree with every part of that opinion. I doubt you can find any "consensus" where everyone thinks exactly the same.
ican711nm wrote:parados wrote:
...
The sun's radiation acts as a block for cosmic radiation. So the cosmic radiation varies based on solar activity which was the whole point of Svensmark's hypothesis about cosmic radiation reducing temperature.
If Svensmark was correct then we would have reduced solar activity AND more cloud cover at the same time which would mean even more of a response to the temperature when the sun goes into a low point in its cycle.
But as we all know with the sun presently in a slow cycle we don't have any cooling to speak of, let alone cooling doubled by an increase in cloud cover.
What scientific sources support your claims here and what are the links to those claims?
So you won't believe Svensmark without a link to his work?

Ok.. here..
http://www.dsri.dk/~hsv/
Enjoy
Come back when you tell us you don't agree with Svensmark.
From Svensmark's 1997 paper, ican....
Quote:
The cosmic ray intensity shows the well-known inverse relationship to the sun spot cycle.
(This is not the paper he hypothesized that the increase in cloud cover because of the increase in cosmic rays would cause cooling but it is work he builds on to reach that hypothesis.)
Are you saying Svensmark based his hypothesis on faulty science, ican?
ican711nm wrote:You neglected to describe or post the ACRIM Composite which shows an increasing TSI trend.
Yes, the ACRIM Composite shows an increasing TSI trend.
Here the ACRIM Composite which you agree with:

Here the PMOD Composite which you
disagree with:

(images via your earlier link)
Can you explain for those scientifically challenged where exactly we can see the
increasing TSI trend in the ACRIM Composite, and why you seem to think that the ACRIM rather than the PMOD Composite is correct?
I'm curious.
ican711nm wrote:Figure 1 covers 1978 - 2007, and is divided into 4 sections: a) Original Data, b) PMOD Composite, c) ACRIM Composite, and d) IRMB Composite. You neglected to describe or post the ACRIM Composite which shows an increasing TSI trend.
Yes, the ACRIM Composite shows an increasing TSI trend.
Oh, and here's 'Figure 1' from the other link:

Again, ican: can you point out how the ACRIM Composite shows an
increasing TSI trend?
I mean: if you start at the beginning of the ACRIM Composite (graph c) and end at the ending, wouldn't the trend be decreasing rather than increasing?
old europe wrote:I mean: if you start at the beginning of the ACRIM Composite (graph c) and end at the ending, wouldn't the trend be decreasing rather than increasing?
Disclaimer: I'm not saying that that would be a legitimate methodology. Then again, you've been picking two random points - a low one earlier and a high one later - and concluded that that shows an increasing trend, which seems to be even more ridiculous.
Now, while I have no idea what Username's background or expertise in this stuff is, but he and I have had a discussion on variables in solar TSI and he seems to hold a point of view that those variables are fairly consistent and predictable within recurring 11-year cycles.
But from NASA I find this:
Quote:. . . .Variations in TSI are due to a balance between decreases caused by sunspots and increases caused by bright areas called faculae which surround sunspots. Sunspots are dark blotches on the Sun in which magnetic forces are very strong, and these forces block the hot solar plasma, and as a result sunspots are cooler and darker than their surroundings. Faculae, which appear as bright blotches on the surface of the Sun, put out more radiation than normal and increase the solar irradiance. They too are the result of magnetic storms, and their numbers increase and decrease in concert with sunspots. On the whole, the effects of the faculae tend to beat out those of the sunspots. So that, although solar energy reaching the Earth decreases when the portion of the Sun''s surface that faces the Earth happens to be rife with spots and faculae, the total energy averaged over a full 30-day solar rotation actually increases. Therefore the TSI is larger during the portion of the 11 year cycle when there are more sunspots, even though the individual spots themselves cause a decrease in TSI when facing Earth.
The bright regions on the Sun that surround sunspots are called faculae. Although sunspots reduce the amount of energy radiated from the Sun, the faculae associated with them increase the radiated energy even more, so that overall, the total amount of energy emitted by the Sun increases during periods of high sunspot activity. (Image courtesy Big Bear Solar Observatory)
The number of sunspots visible from the Earth not only changes from day to day, but also in cycles that can last from decades to centuries to millennia. The most well-known and well-analyzed of these cycles is the 11-year sunspot cycle. Over the course of 11 years, the yearly average number of sunspots and faculae slowly increases and then return to normal levels before rising again for the subsequent cycle. The change in the Sun''s yearly average total irradiance during an 11-year cycle is on the order of 0.1 percent or 1.4 watts per square meter.
The 11-year solar cycle is manifested by the appearance and disappearance of large numbers of sunspots on the Sun''s surface. The image series above shows the Sun at a wavelength of 656.3 nm, where Hydrogen emission just above the Sun''s visible surface reveals increased energy coming from faculae. One image was taken every year from 1980 to 1989. 1980 was near a solar maximum and the Sun was active, while 1986 was near the minimum, and the Sun''s surface was almost featureless. (Image adapted from The Sun: a pictorial Introduction by P. Charbonneau and O.R. White)
Another trend scientists have picked up on appears to span several centuries. Late 17th century astronomers observed that no sunspots existed on the Sun''s surface during the time period from 1650 to 1715 AD. This lack of solar activity, which some scientists attribute to a low point in a multiple-century-long cycle, may have been partly responsible for the Little Ice Age in Europe. During this period, winters in Europe were much longer and colder than they are today. Modern scientists believe that since this minimum in solar energy output, there has been a slow increase in the overall sunspots and solar energy throughout each subsequent 11-year cycle.
http://earthobservatory.nasa.gov/Library/SORCE/sorce_03.html
Seems to me that you guys ought to change your focus from whose solar TSI graphs are more reliable, and focus on sunspot activity that seems to affect influence of TSI on the Earth, and thus seems to be more likely to be influencing climate change.
Foxfyre wrote:Seems to me that you guys ought to change your focus from whose solar TSI graphs are more reliable, and focus on sunspot activity that seems to affect influence of TSI on the Earth, and thus seems to be more likely to be influencing climate change.
Uhm.... Yes, there's a correlation between TSI variability and the varying balance between sunspots and faculae.
Looks like more sunspots - higher TSI; less sunspots - lower TSI. Therefore you can, kinda sorta, use sunspot counts as a proxy for TSI.
It's important to remember that actual
measurements of TSI are only available since the age of satellites, in 1978.
That
is what people are talking about, I believe. Not sure where you disagree?
Foxfyre wrote:Seems to me that you guys ought to change your focus from whose solar TSI graphs are more reliable, and focus on sunspot activity that seems to affect influence of TSI on the Earth, and thus seems to be more likely to be influencing climate change.
Here's a graph that charts both sunspots and TSI:
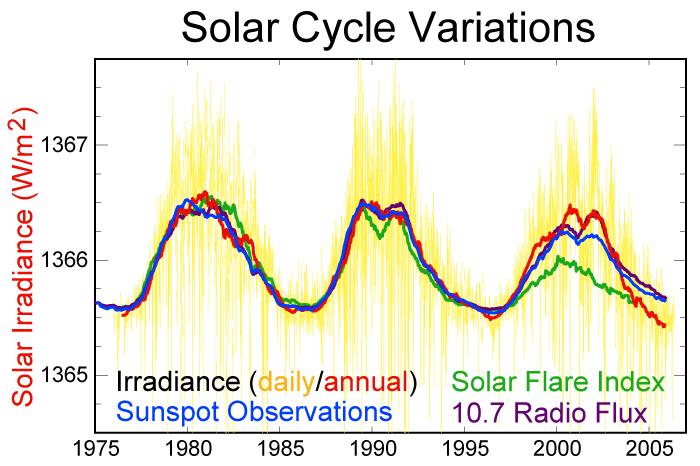
You seem to be saying that we're focused too much on the red line (TSI), and should rather pay more attention to the blue line (sunspot observations)?