My argument is----the jury is still out. I would expect some lag time with solar cycles, and a rough correlation, not a perfect one, but the sun is much closer than CO2. Temperatures have in fact plateaued out and have not risen in around the past 10 years, so we will just have to continue to watch it. As Foxfyre pointed out, if CO2 was the driver of all of this, temperatures would continue to climb steadily, and that clearly is not happening in my opinion.
Blah, blah, blah..
The temperature has "plateaued" while the w/m^2 have decreased by 1.
You can't add heat in the coming increase in the cycle and not get an increase in heat retained. Unless you want to tell us that the laws of physics have changed in the last 10 years.
Is that it okie? Have the laws of physics changed? Can you now add heat to a system but not get an increase? The temperature would NOT climb "steadily" since the source of the energy is variable. The temperature climbs based on the retention and the energy being pumped in. If the energy source is reduced but the temperature doesn't decrease then when the energy source is increased the temperature must go up unless you change some other variable such as making space colder suddenly.
Fox, ican has been consistently wrong. That is the simple fact. He violates the laws of physics when he contended that increasing CO2 was form outgassing from the oceans. He is wrong on TSI. Surely you know sunspots (and TSI) run on an 11-year cycle. TSI goes up about a watt per square meter and then goes down about a watt per square meter over the course of 11 years (roughly). It's as regular as clockwork (well, no, as regular as a sundial). Look at ANY data and you'll see it. Look at the NOAA data he keeps citing. Look at the PMOD graphs. It's clear. That is nearly an order of magnitude greater than any hypothesized change in "average" TSI (which is sort of an abstract concept). To compare TSIs from two years that are at different poiints on that cycle, as he does with 1975 and 2000 is clearly incompetent (to use a word he has used) and illegitimate, becuase if the second point is higher, just wait a couple years and it'll go back down (and then come up again 11 years later, and go back down, and o on...). Anyone who claims that you can tell something about an increase in overall TSI from those two points is totally wacked. He has done that kind of illegitimate comparison repeatedly.
Look at the biocab website. They have no expertise. They do no climate research. They are the next best thing to cranks, on climate, at least. They may do a bit better on biology--I would hope so, at least, since that's what they claim to be trained in. That's the best he can do in terms of science, and it's pathetic.
And, I might add, from the solar data, directly from the people who collect that data (the PMOD folks), TSI has not just started decreasing. It has decreased since about 1978, which is the point at which we first started getting accurate, directly-measured solar irradiance measurement with the first satellite sensors. What happens before that is from proxies not from direct observation.. To think of the solar decrease as something just in the last several years is wrong. It has been at the very best case steady-state, and more probably slowly decreasing as the 2007 measurements confirmed for the thirty years that show increasing temperatures and the hottest years on record. Hard to reconcile declining irradiance over thirty years and rising temperatures over thirty years.
username wrote:Fox, ican has been consistently wrong. That is the simple fact. He violates the laws of physics when he contended that increasing CO2 was form outgassing from the oceans. He is wrong on TSI. Surely you know sunspots (and TSI) run on an 11-year cycle. TSI goes up about a watt per square meter and then goes down about a watt per square meter over the course of 11 years (roughly). It's as regular as clockwork (well, no, as regular as a sundial). Look at ANY data and you'll see it. Look at the NOAA data he keeps citing. Look at the PMOD graphs. It's clear. That is nearly an order of magnitude greater than any hypothesized change in "average" TSI (which is sort of an abstract concept). To compare TSIs from two years that are at different poiints on that cycle, as he does with 1975 and 2000 is clearly incompetent (to use a word he has used) and illegitimate, becuase if the second point is higher, just wait a couple years and it'll go back down (and then come up again 11 years later, and go back down, and o on...). Anyone who claims that you can tell something about an increase in overall TSI from those two points is totally wacked. He has done that kind of illegitimate comparison repeatedly.
Look at the biocab website. They have no expertise. They do no climate research. They are the next best thing to cranks, on climate, at least. They may do a bit better on biology--I would hope so, at least, since that's what they claim to be trained in. That's the best he can do in terms of science, and it's pathetic.
Ican has consistently posted all manner of information re global warming. Some of it is no doubt flawed and some of it is no doubt spot on accurate. But he at least is participating the the debate and has the education and expertise to make sense of much of it that I personally lack.
You and Parados and a few others rather than systematically laying out a theory or block of evidence backed up with credible sources seem to be trying to discredit Ican with anything you can find or make up rather than focus on the substance of his argument. Perhaps a bit less animosity directed toward another member would generate more attention to the actual facts that are available to us.
parados wrote:Foxfyre wrote:I don't know what Ican can say; all I know is that he generally gets it right on this stuff;
I am curious how you know ican gets it right since you don't understand the technical parts of the issue?

Read the chart. Tell us if it goes up or down. Simple to do Fox. Then compare your reading to what ican has argued. If you think ican generally gets it right then you are correct in that you don't understand the technical stuff but way off in saying that ican generally gets it right. He understands the technical stuff less than you do and you have admitted you don't understand it.
I know Ican gets it a lot of it right because much of what he says is also said by people, both from posted sources and members participating on this thread, who do have more scientific credentials and expertise than Ican does or I do or you do. You see, some of us are actually reading ALL the arguments and drawing a conclusion from the whole body of evidence.
Some of you are trying to discredit people are are doing that and who are drawing different conclusions that what you say you have drawn.
parados wrote:Blah, blah, blah..
The temperature has "plateaued" while the w/m^2 have decreased by 1.
You can't add heat in the coming increase in the cycle and not get an increase in heat retained. Unless you want to tell us that the laws of physics have changed in the last 10 years.
Is that it okie? Have the laws of physics changed? Can you now add heat to a system but not get an increase? The temperature would NOT climb "steadily" since the source of the energy is variable. The temperature climbs based on the retention and the energy being pumped in. If the energy source is reduced but the temperature doesn't decrease then when the energy source is increased the temperature must go up unless you change some other variable such as making space colder suddenly.
You pretend as if you have all the numbers pinned down to make hair splitting calculations, which is nonsense. The most important greenhouse gas, water vapor, how about the historical data for that? You also pretend that all kinds of other factors are known or static. Good grief. I think you are in way over your head, Parados.
I'm curious, does anybody know whether Username is correct that solar TSI is constant in 11-year cycles? I'm almost certain I have read where that is not the case; but they won't accept my usual experts on that. So does anybody have a source or information they will accept?
Foxfyre wrote:I'm curious, does anybody know whether Username is correct that solar TSI is constant in 11-year cycles? I'm almost certain I have read where that is not the case; but they won't accept my usual experts on that. So does anybody have a source or information they will accept?
I recommend username be asked what he means by "solar TSI is constant in 11-year cycles." He may mean literally that the TSI is invariant with the sun's 11-year sunspot cycles. However, it is more likely he means the TSI varies the same way and same amount with each 11-year sunspot cycle. But then he may mean something else all together.
Regardless of what username actually means, the TSI is not invariant within the sun's 11-year cycle, nor does it vary the same way and same amount each cycle.
Fox, try "sunspot" and "solar variation" on Wikipedia for some general background information on the discussion, such as it is, here
In a nutshell, the question is, we know the sun is very slightly variable. How and when does it vary, and by how much. We know some of it is cyclic, not totally regular but in general regular. Some may be acyclic and over centuries or millennia. Has it changed in the historic record, and
what can we tell about that change.
Solar irradiance is measured (now, since satellite sensors were developed and lofted in 1977, at the Top of the Atmosphere--TOA; before 1977 only indirectly by "proxies", measurements of its effects on something at the earth's surface or the atmosphere--their significance and accuracy is hotly debated) in watts per square meter, which we seem to usually be writing as W/m^2 or Wm^-2. People talk about a "solar constant" (you can look that up too)(which isn't really constant) of around 1365 or 1366 W/m^2.
The largest change in irradiance occurs on an 11-year cycle, the sunspot cycle (everybody calls it the "11-year cycle" even tho its length varies between roughly ten years and twelve years, because, gee, it averages a bit longer than 11 years). They've been charting the number of sunspots since the early 1700s, and someone in the 1800s realized it was essentially cyclic. The change in irradiance from peak to trough in the cycle is roughly 1.3 W/m^2, i.e. about 0.1%.
There was some suggestion from proxy data that TSI might be increasing by a very small amount, typically suggested in the last century or so that it might have been up to 0.1 W/m^2 per decade. Notice the scale here, Fox. We're talking very, very small changes. The anti-global warming people said this hypothesized very small change was enough to cause the warming we've seen since the last half of the last centuryt. The climate scientists in general said if it existed it wouldn't have come anywhere near doing it.
Until we had satellite sensors, there was no way to tell with anything like adequate precision whether or not this change in TSI was actually occurring. We just did not have instruments precise enough, or a place to measure it independent of what goes on in the atmosphere to muddy the question. Now, after three complete solar cycles measurable by satellite, the data say that solar irradiance is not increasing, even by that very very small amount, that it has in fact decreased (very very slightly--just as the increase had it existed would have been very very slight) from the first solar maximum measured in about 1980.
If something has a direct effect on global temperature, the scientists call it a "forcing". Forcings can be positive or negative (i.e. cause temp to rise or fall). The IPCC's FAR, based on additional research in the, I think, six years or so since the TAR (Fourth and Third Assessment Reports, respectively), have in fact reduced the effect of solar forcing in the climate models by about half (I'm pulling these numbers out of memory, and I don't vouch for toatl accuracy), now about 0.12 W/m^2, versus CO2 which has a forcing effect of about 1.6 W/m^2.
Yes, the IPCC represents the consensus--the large majority of climate scientists. It's not unanimous, but it's the paradigm that makes sense of the data. And, no, Fox, ican does not present a wide range of information. What he presents are the same few pieces of "evidence" all the anti-global-warming contrarians present over and over. Almost all the "data" he uses is some variant of what's in that one OISM "paper" he keeps recycling, a version of which the prestigious NAS said did not represent their opinion. The NASA data does not say what he thinks it does about post 1975, nor does he interpret it validly. And while he may or may not replay the dubious denialist literature correctly, whenver he goes off on his own and starts presenting his own hypotheses and "statistics" he goes wildly awry.
And, no, ican, I don't say the cycle repeats exactly. I in fact suggested you look at the PMOD figures which show some of the variation in sensor reading that you get over the course of a cycle, which have in fact varied up to about 6W/m^2 (which is why it's nonsense to pick one day's reading and say "This is the TSI", as if it were the final word on what the sun is doing.as you have done It's that day's reading. It's what the sun did that day, no larger significance. It's only by looking at the whole body of data that you can come up with something like THE irradiance. As usual, of course, you don't actually look at the data. However the cycles are roughly similar, about 11 years and from about lower-to-mid 1365 W/m^2 to mid-to-upper 1366, which variation is far more than any proposed (and definitely not observed)increase in "average" TSI.
username wrote:And, no, ican, I don't say the cycle repeats exactly. I in fact suggested you look at the PMOD figures which show some of the variation in sensor reading that you get over the course of a cycle, which have in fact varied up to about 6W/m^2 (which is why it's nonsense to pick one day's reading and say "This is the TSI", as if it were the final word on what the sun is doing.as you have done It's that day's reading. It's what the sun did that day, no larger significance. It's only by looking at the whole body of data that you can come up with something like THE irradiance. As usual, of course, you don't actually look at the data. However the cycles are roughly similar, about 11 years and from about lower-to-mid 1365 W/m^2 to mid-to-upper 1366, which variation is far more than any proposed (and definitely not observed)increase in "average" TSI.
You did say this however:
Quote:TSI goes up about a watt per square meter and then goes down about a watt per square meter over the course of 11 years (roughly). It's as regular as clockwork (well, no, as regular as a sundial).
Are you going to stand by this statement?
username wrote:And, no, ican, I don't say the cycle repeats exactly. I in fact suggested you look at the PMOD figures which show some of the variation in sensor reading that you get over the course of a cycle, which have in fact varied up to about 6W/m^2 (which is why it's nonsense to pick one day's reading and say "This is the TSI", as if it were the final word on what the sun is doing.as you have done It's that day's reading. It's what the sun did that day, no larger significance. It's only by looking at the whole body of data that you can come up with something like THE irradiance. As usual, of course, you don't actually look at the data. However the cycles are roughly similar, about 11 years and from about lower-to-mid 1365 W/m^2 to mid-to-upper 1366, which variation is far more than any proposed (and definitely not observed)increase in "average" TSI.
Previously, username, you
Quote:Posted: Wed 02 Apr, 2008 12:45 pm:
--------------------------------------------------------------------------------
And, I might add, from the solar data, directly from the people who collect that data (the PMOD folks), TSI has not just started decreasing. It has decreased since about 1978, which is the point at which we first started getting accurate, directly-measured solar irradiance measurement with the first satellite sensors. What happens before that is from proxies not from direct observation.. To think of the solar decrease as something just in the last several years is wrong. It has been at the very best case steady-state, and more probably slowly decreasing as the 2007 measurements confirmed for the thirty years that show increasing temperatures and the hottest years on record. Hard to reconcile declining irradiance over thirty years and rising temperatures over thirty years.
Please provide a link that supports this statement of yours?
Already posted. Several times in fact. All on the PMOD graph. All the numbers are there. Do the math for yourself if you doubt me. And remember thery're the people that produce the data in the first place. Not Biology Cabinet. Not OISM.
Fox, notice the abouts and the roughlys. If you're asking about the "clockwork" part, that was a bit of a joke, so I could work in the "sundial", since it is, of course, a great big sundial, THE sundial in fact. Obviously a joke you didn't appreciate. Too bad. No, it's not to the second, to the minute, to the hour, even to the month ("roughly"?, remember, in the post?) The eleven-year cycle has been common knowledge for more than a century, the fact that it's not exactly eleven years, or exactly the same every time has been common knowledge too. In one of my previous incarnations, I worked through several maxima, in fact--plays hell on radio. But it goes up, it goes down, sometimes worse, sometimes somewhat better, and come back in around eleven years and it'll be doing something pretty close to what it's doing now, then. As I said.
username wrote:Fox, notice the abouts and the roughlys. If you're asking about the "clockwork" part, that was a bit of a joke, so I could work in the "sundial", since it is, of course, a great big sundial, THE sundial in fact. Obviously a joke you didn't appreciate. Too bad. No, it's not to the second, to the minute, to the hour, even to the month ("roughly"?, remember, in the post?) The eleven-year cycle has been common knowledge for more than a century, the fact that it's not exactly eleven years, or exactly the same every time has been common knowledge too. In one of my previous incarnations, I worked through several maxima, in fact--plays hell on radio. But it goes up, it goes down, sometimes worse, sometimes somewhat better, and come back in around eleven years and it'll be doing something pretty close to what it's doing now, then. As I said.
No, I got the joke and understand what you're saying re unequal variances that even out to be roughly the same over 11 year cycles.
What I'm asking is do you stick by your statement that each 11 year cycle will not vary that much from other 11 year cycles? Not enough to make any appreciable difference on climate influence?
If you're having trouble doing the math, let me help you out. A solar cycle officially starts with the first observation of a reversed-polarity sunspot after a minimum. We just started cycle 24 on Jan. 24. So the three cycles on the satellite record run from cycle 21 1977 (already part way in, that's when the satellites go up) to about 1986, cycle 22, to about 1996, and cycle 23 until a couple months ago.
Average of minima--self-explanatory.
Difference of minimum from average--how far above or below that min is above the ave. of minima. Add or subtract to/from average depending on sign, to get cycle min.
Amplitude--distance from max to min. Since cycle is defined as starting at end of previous min, its max comes several years into the cycle and precedes that cycle's min, which ends the cycle. Add amplitude to min to get max.
Notice the decline in both min and max.
username wrote:Already posted. Several times in fact. All on the PMOD graph. All the numbers are there. Do the math for yourself if you doubt me. And remember thery're the people that produce the data in the first place. Not Biology Cabinet. Not OISM.
Surely you can provide us a link to the specific PMOD graph you are referring to!
Meanwhile, I'll wait with this:
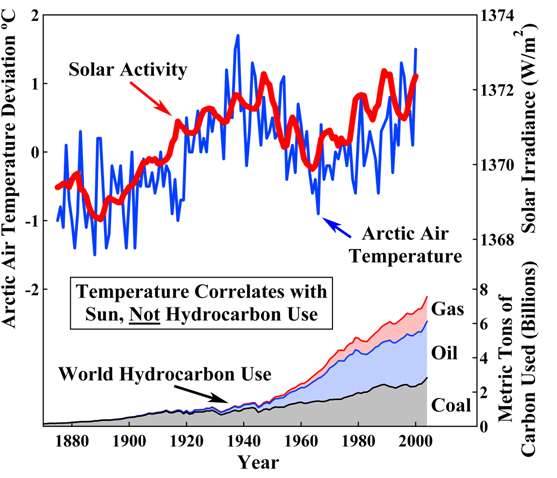
Solar Activity versus to CO2 activity,
AND this:
http://tamino.wordpress.com/2007/07/24/pmod-vs-acrim/
PMOD versus ACRIM
Interesting link. Thanks.
(okay. just reading along. carry on, y'all)