ican711nm wrote:parados wrote:ican711nm wrote:
However, I also claim that both sources show an increase in TSI from 1975 to 2000.
Of course they show an increase from 1975-2000. They will show an increase almost anytime you pick the minimum and compare it to the maximum in the 11 year cycle.
Your argument is illogical. The period
2000-1975 = 25 years. That's enough for a little more than two 11 year solar cycles. The evidence my sources provide us indicates the TSI 2nd cycle in that period is higher than the 1st cycle in that period. Add another five years and you discover 2005-1975 = 30. That's almost enough for three successive solar cycles with each cycle possessing higher TSIs than the previous cycle. Add another 2 years to get to 2007, and my sources show that increasing TSI trend continuing.
I expect that trend will eventually reverse even while the CO2 content of the atmosphere continues to increase. However, after that I expect global temperature will first moderate and then decrease. After that, I expect the CO2 density will subside as more CO2 is condensed out of the air and is absorbed by the earth's water and land surfaces. Can I prove my expectations are valid? No! And can you prove my expectations are invalid? I bet not!
Your sources show the opposite.
Which sources shall I believe--yours, mine, or someone else's? Why? Those are rhetorical questions, because I do not believe you know the answer, though you might pretend to.
...
But you are just filled with nonsense time and again ican.
I rarely, if ever, buy the arguments of those like you who employ slander to argue their case. For that reason, I don't believe you are capable of competent argument on this topic.
...
You don't even know what your own sources provide.
Lean graphs which you have posted in support of your argument you then post a website that claims Lean is WRONG when Frohlech (Lean's coauthor) claims the TSI is decreasing.
Which is it? Do you agree with Lean's numbers or disagree with them?
The solar cycle is APPROXIMATELY 11 years. It is NOT exact. You tell the high and low of the cycle by looking at the numbers. The cycle is LOW when the W/m^2 is low and high when the W/m^2 is high. The cycle is really quite easy to see in Lean's graph. 1975 is a low point on the cycle. It is lower than the years before and after it. 2000 is almost the high of the cycle. It is HIGHER than 1999 and 1998 and 1997 etc. To compare 1975 to 2000 is to completely ignore the variation in the cycle.
Are you really trying to tell us that 2000 is a low point in the 11 year cycle ican? I don't see how I can be calling you names when you constantly prove my statements correct.
ican711nm wrote:Foxfyre wrote:okie wrote:Yes, posting graphs is great, except I got a tongue lashing from some liberal one time for stretching the screen so that you have to scroll back and forth to read posts. ...
...
Because the content of the graphs is so good though, does anybody know a way to easily resize them BEFORE they are posted? Otherwise, probably better to just use a link instead of posting the graph.
Foxfyre, I don't yet know how to reduce the sizes of graphs before I post them. However, after I post them I select "Zoom" and then "Zoom out" after pressing my "Page" button. However, that reduces the size of all the regular print text as well as the size of graphs on the page I'm looking at.
I can certainly appreciate the problem. Took me forever to learn how to post a a long link to a source so that it didn't stretch the page. I still haven't learned how to post an oversized picture or other graphic.
But hey, I've advanced to the point that I recognize a computer when I see one two out of three times now.

Quote:1972.5 1366.0519 1366.0541
1973.5 1365.8131 1365.7612
1974.5 1365.7448 1365.6792
1975.5 1365.5466 1365.5020
1976.5 1365.6458 1365.6442
1977.5 1365.8248 1365.8557
1978.5 1366.2616 1366.3101
1979.5 1366.6193 1366.6769
1980.5 1366.6323 1366.6913
1981.5 1366.6829 1366.7280
1982.5 1366.2808 1366.2999
1983.5 1366.1989 1366.2001
1984.5 1365.8088 1365.8145
1985.5 1365.6382 1365.6506
1986.5 1365.6345 1365.6470
1987.5 1365.7865 1365.7990
1988.5 1366.0792 1366.0918
1989.5 1366.6445 1366.6570
1990.5 1366.5499 1366.5624
1991.5 1366.4423 1366.4547
1992.5 1366.2987 1366.3112
1993.5 1366.0251 1366.0377
1994.5 1365.7937 1365.8063
1995.5 1365.6962 1365.7087
1996.5 1365.6086 1365.6211
1997.5 1365.7365 1365.7489
1998.5 1366.0986 1366.1111
1999.5 1366.3817 1366.3942
2000.5 1366.6620 1366.6744
Lows in blue
highs in red.
The 11 year cycles do NOT match the calender years.
No where do I see this 1 w/m^2 increase you have claimed other than in the high to low in the cycle.
parados wrote:Quote:1972.5 1366.0519 1366.0541
1973.5 1365.8131 1365.7612
1974.5 1365.7448 1365.6792
1975.5 1365.5466 1365.5020
1976.5 1365.6458 1365.6442
1977.5 1365.8248 1365.8557
1978.5 1366.2616 1366.3101
1979.5 1366.6193 1366.6769
1980.5 1366.6323 1366.6913
1981.5 1366.6829 1366.7280
1982.5 1366.2808 1366.2999
1983.5 1366.1989 1366.2001
1984.5 1365.8088 1365.8145
1985.5 1365.6382 1365.6506
1986.5 1365.6345 1365.6470
1987.5 1365.7865 1365.7990
1988.5 1366.0792 1366.0918
1989.5 1366.6445 1366.6570
1990.5 1366.5499 1366.5624
1991.5 1366.4423 1366.4547
1992.5 1366.2987 1366.3112
1993.5 1366.0251 1366.0377
1994.5 1365.7937 1365.8063
1995.5 1365.6962 1365.7087
1996.5 1365.6086 1365.6211
1997.5 1365.7365 1365.7489
1998.5 1366.0986 1366.1111
1999.5 1366.3817 1366.3942
2000.5 1366.6620 1366.6744
The link from whence your list came, I'LL CALL LIST L:
L= Http://www1.ncdc.noaa.gov/pub/data/paleo/climate_forcing/solar_variability/lean2000_irradiance.txt
Calculation of TSI from calc_tsi_ann.pro
Mon Apr 2 15:18:18 2001
List L was used to produce this graph; I'LL CALL IT GRAPH A:
A= http://www.biocab.org/Solar_Irradiance_English.jpg
Solar Irradiance 1611 to 2001
Lows in blue
highs in red.
The 11 year cycles do NOT match the calender years.

No where do I see this 1 w/m^2 increase you have claimed other than in the high to low in the cycle.
This particular claim of mine, 1 w/m^2 increase 1975 TO 2005, IS NOT BASED ON L & A. This CLAIM IS BASED ON THE FOLLOWING GRAPHS I'LL CALL GRAPH B AND GRAPH C:
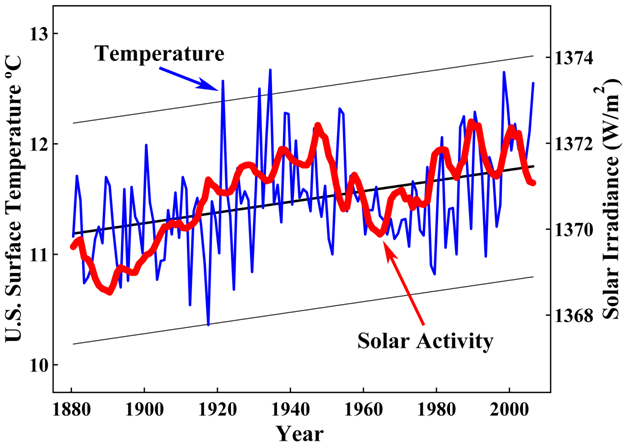
B= http://www.oism.org/pproject/Slides/Presentation/Slide5.png
US Surface Temperature Trends versus Solar Activity
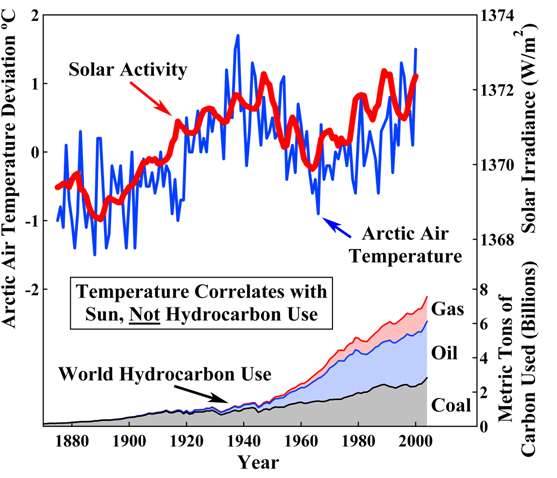
C= http://www.oism.org/pproject/Slides/Presentation/Slide3.png
Arctic Air Temperature versus Solar Activity and CO2 trend
L & A, DO NOT AGREE WITH B & C. HOWEVER, L & A SHOW AN INCREASING SOLAR RADIANCE AFTER 1975. THAT INCREASE IS GREATER THAN 1.0 W/M^2.
I DO NOT KNOW WHICH,
L & A, OR B & C, ARE THE MORE ACCURATE.
Considering you aren't even reading B & C correctly, does it matter which ones are more accurate?
B & C do NOT show an increase of 1w/m^2 from 1975-2005.
B goes from 1370.625 in 1975 to 1371.25 in 2005
1371.25-1370.625 = .625 which is NOT 1.
Your second graph does NOT go to 2005 with the TSI. It stops at the year 2000.
Just because you don't know which is more accurate does NOT give you the freedom to make up what you think they say. None of your sources upon examination support your 1w/m^2 claim.
parados wrote:Considering you aren't even reading B & C correctly, does it matter which ones are more accurate?
B & C do NOT show an increase of 1w/m^2 from 1975-2005.
B goes from 1370.625 in 1975 to 1371.25 in 2005
1371.25-1370.625 = .625 which is NOT 1.
Your second graph does NOT go to 2005 with the TSI. It stops at the year 2000.
Just because you don't know which is more accurate does NOT give you the freedom to make up what you think they say. None of your sources upon examination support your 1w/m^2 claim.
You have made progress! Now you appear to understand that solar irradiance has increased since 1975. You now only disagree with me about how much it has increased and over how many years that increase occurred since 1975.
You neglected only to acknowledge the increase reported by L & A.
From your post:
Quote:1975.5 1365.5466 1365.5020
2000.5 1366.6620 1366.6744
The increases 1975.5 to 2000.5 are:
1.1054 1.1724
But so what! Your progress is good!
ican711nm wrote:parados wrote:Considering you aren't even reading B & C correctly, does it matter which ones are more accurate?
B & C do NOT show an increase of 1w/m^2 from 1975-2005.
B goes from 1370.625 in 1975 to 1371.25 in 2005
1371.25-1370.625 = .625 which is NOT 1.
Your second graph does NOT go to 2005 with the TSI. It stops at the year 2000.
Just because you don't know which is more accurate does NOT give you the freedom to make up what you think they say. None of your sources upon examination support your 1w/m^2 claim.
You have made progress! Now you appear to understand that solar irradiance has increased since 1975. You now only disagree with me about how much it has increased and over how many years that increase occurred since 1975.
You neglected only to acknowledge the increase reported by L & A.
From your post:
Quote:1975.5 1365.5466 1365.5020
2000.5 1366.6620 1366.6744
The increases 1975.5 to 2000.5 are:
1.1054 1.1724
But so what! Your progress is good!
As I previously stated and you obviously can't comprehend...
1975 to 2000 compares the minimum of the cycle to the maximum of the cycle. If 2000 wasn't higher than 1975 then the 11 year cycle that goes from maximum to minimum and back to maximum would not exist.
You didn't state 1975 to 2000 for the 1w/m^2 increase however, you said 1975 to 2005. 1975 to 2005 does NOT show a 1w/m^2 increase.
It's my opinion that this opinion is closest to the truth, and will prevail.
Quote:
http://www.biocab.org/Solar_Irradiance_is_Actually_Increasing.html
...
From the actual data we conclude that the graphs from Lockwood and Frölish were flawed:
1- Examine closely the graph and you'll see how the solar irradiance radiation has increased, not decreased. The trend line (dashed line) is clearly rising. We cannot rebuff evidence.
2- Lockwood and Frölish took only the last portion from data corresponding to years 1985-2006. Those data indicate that the number of sunspots has been decreasing, but the solar irradiance is really increasing. The only year with a remarkable change of temperature was 1998. From that year to date, the temperature has not had absolutely a trend denoting an increasing, but quite the opposite, a trend to decrease (see a graph here). This has a clear connection with solar activity. If Lockwood and Frölish assure that the solar activity is diminishing, the thermometers on surface indicate that the tropospheric temperature is also diminishing, which forcefully falsifies the logic fallacy of Lockwood and Frölish.
3. The methodology used by Lockwood and Frölish to smooth the lines was applied only to maxima of R (sunspot number), dismissing the TSI. This practice hides the minima, which for the issue are more important than the maxima. For example, if the minimum of TSI in 1975 was 1365.5 W/m^2, it would contrast dramatically with the minimum of TSI of 1998 that was 1366 W/m^2 (0.033% higher). That would make the Sun in 1975 "colder" than in 1998. However, if we compare minimum values with maximum values, then the Sun would be frankly "warmer" in 1998 -when the solar energy output was 1366 W/m^2- than in 1975 -when the energy output was 1366.1111 W/m^2. Today (21/07/07), the global TSI was 1367.6744 W/m^2); hence, we see that we must not smooth maxima values through movable trends because we would be hiding the minima values, which are more important because the baseline of the "cooler" or lower nuclear activity of the Sun are higher everyday. The coolest period of the Sun happened during the Maunder Minimum when the TSI was 1363.5 W/m^2. The coolest period of the Sun from 1985 to date occurred in 1996 when the TSI was 1365.6211 W/m^2. An interesting blotch is that in 1985 the TSI was 1365.6506 W/m^2 and in 2000 was 1366.6744.
4. The graph of tropospheric temperatures is Hansen's twisted graph. Many of us for many times have demonstrated that it does not match with reality.
5. Lockwood and Frölish dismissed entirely the original work of Judith Lean et al published in 2001, which mysteriously disappeared from NOAA site. However, you can review data at NASA and below this paragraph:
...
ican, your source Biology Cabinet (biocab) is another one of your many that has no credibiliity in the field. It's essentially four guys originally (now apparently one guy), in New Braunfels,Texas, not exactly a hotbed of research, or anything else. It's a blog, basically. They have no solar expertise and do no research in the field. They only claim (unspecified) education in biological sciences, and from the work they cite and seem to be proudest of, what they mainly deal in is routine identification of plant and animal pathogens for agriculture. Whoopee. Their posts also are pretty much incoherent.
Try something with some authority, why don't you, for example the one Parados gave you, the World Radiation Center at Davos. If you ever actually looked at the original science on solar irradiance, you see PMOD everywhere in the data. That's them (Physikalish-Meteorologisches Observatiorium Davos). They analyze the data. Look at it some time.
Look, for example, at their graphs of TSI from satellite measurements since 1977. Notice the variation in readings (the color bars up and down from the curves. Notice why BioCabs "Today the solar irradiance is 1367" is meaningless, because if you cite the TSI from one day, depending on the day, you could get a range from 1362 W/m^2 to 1368W/m^2. At one point in 2003 you could legitimately have said, the TSI that day was 1362, lower than any (controversial) reconstructions of the Maunder Minimum. Which makes your chosen method of trying to convince us that TSI is increasing even more simplistic and absurd. Which is why researchers do curve smoothing to get a coherent picture of what's happening.
Look at the graphs again. Notice that what Parados has been telling you is true. The variation in TSI between maxima and minima of solar cycles is at least an order of magnitude greater than any of the hypoothesized changes in TSI over the satellite period. And that change from maxima to minima is barely detectable in the climate record on the ground.
Now look at their data for minima. Keep in mind TSI change is usually calculated from minima. Minima re decreasing. And so, for that matter, are maxima.
From the PMOD data,
TSI 1986 cycle 21 min 1366.568W/m^2
TSI 1996 cycle 22 min 1366.558
TSI 2007 cycle 23 min 1365.245
And for that matter, the maxima are declining as well. For the respective cycles the maxima re 1366.493, 1366.452 and 1366. 241.
[/b]IT'S GOING DOWN, ICAN. NOT UP[/b]
Here's the url
http://www.pmodwrc.ch/pmod.php?topic=tsi/composite/SolarConstant
Explore the site. Explore the Biology Cabinet site. Try to tell me that biocab has anywhere near PMOD's credibility, research experience, or expertise.
For that matter, ican, talking about one-horse operations, poke around )OISM's website, look at SourceWatch's account of their activities and try to convince me that Arthur Anderson, the OISM principal, isn't half a crackpot (at least) (OISM, in case you haven't made the conncection, as you apparently didn't with Willie Soon, is the source of your favorite "paper" and graphs). Again, NO expertise in the field, NO research in the field.
Sorry, just went back and reread my post and my typing sucks. The CORRECT numbers for TSI are:
TSI 1986 1365.568 W/m^2
TSI 1996 1365.558
TSI 2007 1365.245
And for the record they've also back-interpolated a TSI value (non-satellite-sensor) for 1975:
TSI 1975 1365.536
TSI has also decreased from that figure.
IT'S GOING DOWN, NOT UP. SORRY, BUT THAT'S THE WAY IT GOES (DOWN)
Then your figures would certainly support the current data that the rise in global temperatures has stablilized over the last several years and have somewhat decreased. Looking at all those graphs over the last several days, there is not immediate reaction of climate conditions to solar fluctuations but it appears obvious that solar is a primary driver of trends nevertheless.
Nice try, Fox. If you guys want to shift your ground and accept the fact that the sun's ouput isn't increasing, as your argument has run, that's fine with me. Knock one prop out and your whole shaky enterprise gets even shakier. Over the last thirty years the sun hasn't gone up, but the temperature has. Long time for your "correlation" to take effect. Last winter was a moderate el Nino, which gave way to a fairly strong la Nina, and climate researchers will tell you you see those effects in the record far more strongly than anything the sun does, and have "cooled us off" all the way to what we had in 2001, sixth hottest winter on record. Whoopee. That's weather, not climate. But go ahead, accept the facts, and let's see what happens when the temps go up. They're going to. Simple physics.
Now wait a minute, you yourself just said that TSI is marginally down. And it has been pointed out from at least one source/study that ocean temperatures have stablilized and marginally decreased over the last several years.
So, if solar TSI is a significant driving force re climate change, would you not agree that your own assessment of lowered TSI and the current suggested leveling off or at least plateauing of global warming could be related?
But the minimal decrease in temperature has been at a time when the solar cycle has gone from its high to its low. That means the solar cycle will start going back up but the temperature has "plateaued" at the same time the solar cycle went down.
If solar energy is the only force on driving up earth's temperature then the temperature should have dropped the same as the solar irrradiance was reduced. But suprise, the temperature of the earth hasn't dropped that same amount. ican has been arguing that if the solar irradiance goes up by 1w/m^2 then the temperature should go up. Shouldn't the reverse be true if the solar irradiance drops by 1w/m^2? Ican is defeating his own argument but can't see it because he is too busy trying to wiggle the numbers to be what they aren't.
When you add more heat to the earth as the solar cycle increases. what do you think will happen Fox? It isn't going to cool down. That's for sure.
Since 1975, the solar irradiance has stayed fairly constant other than the 11 year cylce variance. But at the same time the solar irradiance has stayed CONSTANT.. Let me repeat that for your Fox. The solar cycle has stayed CONSTANT. It may have gone down slightly but the .1 decrease in W/m^2 is minimal for all statistical purposes. The variation is 10x that or more over the 11 year cycle. Since there is no real change in the solar energy from 1975 to today where is that retained heat coming from? What has changed and why has it changed?
So to recap, in the last several years the TSI has gone down by a little over 1w/m^2. In the next several years the TSI will go up by 1w/M^2 before it goes back down. What do you think the temperature is related to Fox?
I'm not a science wonk Parados and all the graphs and analytic data go right over my head and I don't pretend to know which represent valid research and which represent manufactured propaganda.
But I can see something and make logical deductions. I can see that average mean temperatures seldom if ever correlate exactly with the solar TSI on any of the graphs that have been posted but the general trends generally do correlate. My logical deduction from this is that solar TSI is likely the most important factor driving the big picture climate trends, but that it is not the ONLY factor and that other factors will have short term influence on the overall trends.
username wrote:
The CORRECT numbers for TSI are:
TSI 1986 1365.568 W/m^2
TSI 1996 1365.558
TSI 2007 1365.245
And for the record they've also back-interpolated a TSI value (non-satellite-sensor) for 1975:
TSI 1975 1365.536
TSI has also decreased from that figure.
IT'S GOING DOWN, NOT UP. SORRY, BUT THAT'S THE WAY IT GOES (DOWN)
TSI has increased from 1975 to 2007. Your source for your numbers is incompetent at best and fraudulent at worst.
Here are two of my sources:
http://www.biocab.org/Solar_Irradiance_is_Actually_Increasing.html
http://www1.ncdc.noaa.gov/pub/data/paleo/climate_forcing/solar_variability/lean2000_irradiance.txt
