I'll try to be non-partisan for a moment here myself, PDiddie. Of course any one poll, or even series of polls, may be off-the-mark; that's a given. At best, a poll is just a snapshot of the mood of a given set of folks at a given point in time - this has been discussed at length here on this thread and just about anywhere else polls are discussed. From a single poll little of meaning can be drawn. A glimpse into actuality is provided only be examining the trending of a poll over a series of sample periods. Whether A or B is ahead or behind by whatever amount in a given poll's results largely is immaterial apart from how that particular result compares with its direct predecessors. If one or the other displays upward/downward momentum, or inertia - a resistance to change ... a consistent direction of movement over time, it reasonably may be inferred, whatever the reported numbers, that something meaningful is being said of that one's prospects.
Now, with that said, it also needs to be understood that any one result, or any one poll or poll series may be abbertational ... an "outlier". Should that divergence from the mean of its contemporaries persist, the accuracy of the subject report falls to question. Not necessarilly does that mean the poll is "wrong", per se, but an outlier is just that; outside the norm. It is not unheard of for a given poll to be ahead of the curve compared with its contemporaries. As exampled most recently by Gallup's unexpected post-RNC breakout, the rest of the polls may begin to track more closely with the outlier, indicating the direction of movement shown, regardless its magnitude, likely is real. Conversely, and more commonly, an outlier on subsequent releases will trend back toward congruence with the pack, indicating the individual outlier itself was not truly representational.
Finally, with all that said, it must be understood the best information to be gleaned from polls is derived by comparing a broad sample of polls from different organizations, partisan, independent, commercial, academic, what have you, charting the trendline created by placing each poll's reported results-over-time onto the graph. This method greatly reduces the impact of both of partisan sentiment and abberational results, "smoothing the bumps", so to speak, and enhances the overall accuracy of any inferrence drawn therefrom. As mentioned earlier in this little essay, the magnitude of the difference between A and B is statistically of somewhat less significance than are the trendlines thus revealed, and the consitency, or momentum, of those trendlines. That, of course, is more work than just looking at a given poll or polls on a given date, and the information derived is far less subject either to "spin" or misinterpretation. Saving one the effort of broadbased poll tracking,
RealClearPolitics, among others, including our very own nimh, does precisely that; look at many polls, from many organizations of every stripe, and present conclusions drawn from examination of congruences, differences, and trending.
Here is RealClearPolitics' current assessment, updated through yesterday's releases:
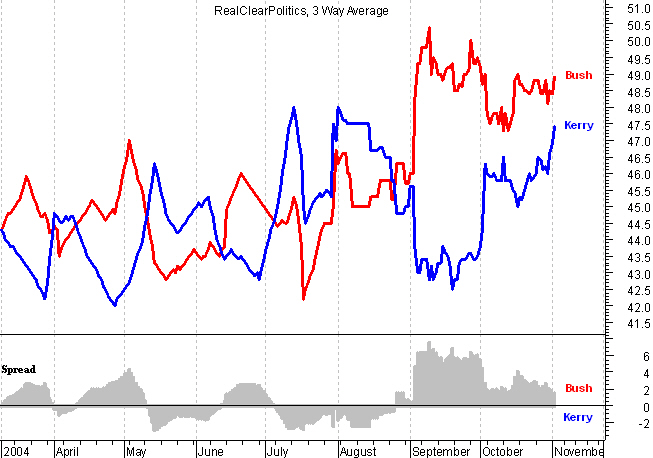
What inference do you draw from the trending charted there?
edited to add: It just dawned on me the link for that chart image goes not to a static chart, but to the chart as it is updated daily. So, its correct as of the time you view it. Incidentally, the movement since it tirst was posted hasn't dismayed me a bit as of this writing, early evening Sept 18th.
