"Crops under stress as temperatures fall
Our politicians haven't noticed that the problem may be that the world is not warming but cooling, observes Christopher Booker. "
http://www.telegraph.co.uk/comment/columnists/christopherbooker/5525933/Crops-under-stress-as-temperatures-fall.html
It isn't just the story itself that is interesting, but it raises questions in my mind, as follows: The story names places with unusually cooler weather, such as Canada, America Midwest, Norway, Saudi Arabia, South America, Brazil, Argentina, China, Eastern Europe and Ukraine, Great Britain, etc. I have seen other articles talking about cooler temperatures in other places. I realize these stories are anecdotal, however, the anecedotal stories seem to pretty numerous from all around the world. And what I see around me certainly does not indicate warming, or any noticeable difference since I was a kid, I still plant gardens about the same time, and I expect the last freeze or the first frost in Spring and Fall to be the same as it was a long time ago.
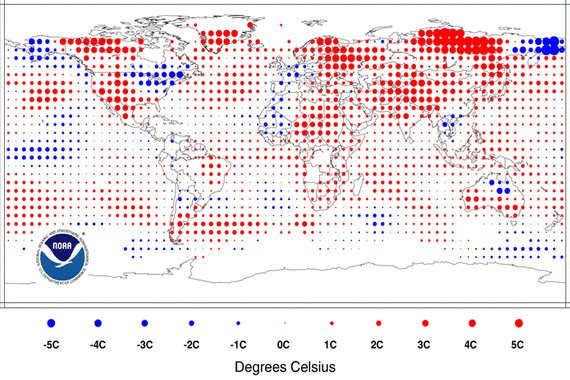
So my question is how do we know the climate monitoring stations or people are not cooking the books? All you would need would be certain countries or regions to be skewed to do it. And all you need is a fraction of a degree. Whenever checked, I have noticed the following map seems to consistently show the hottest spots as Siberia. As a skeptic, and one that wants to always see something for myself, I would like to see the data, see the temp stations, etc. I am not making an accusation, I am merely being skeptical, as skewed data would not be a surprise at all. After all, this issue has turned into a very big political football, wherein it has become a pivotal point or a lever to be used economically against the United States by certain other countries. Skewing the data would not surprise me in the least, or skewing how the monitoring stations are situated or monitored, there would be a number of ways to skin a cat.:
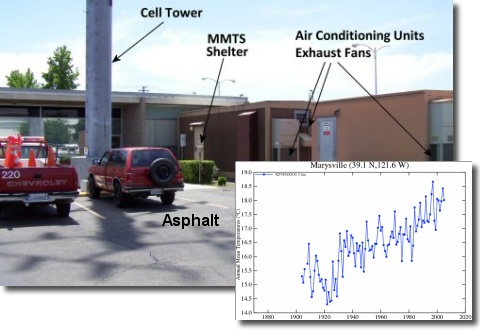
Sure enough, take a look at this website, good evidence of bad monitoring all over the United States. Look at all the orange and red pins rated at possibly skewed .02 or .05 C or greater:
http://www.surfacestations.org/


Example of a monitoring station, a bad one, obviously: