74
   

Global Warming...New Report...and it ain't happy news


Walter Hinteler
 
  1  
Reply Sun 1 Oct, 2006 02:07 am
Walter Hinteler wrote:
P.V. Foukal, C. Föhlich, H.C. Spruit, T. Wigley: Variations in solar luminosity and its effect on the Earth's climate, Nature (14. September 2006)
Summary with movie links at the Max Planck website


Forgot that:

the related institutes are completely:

- Heliophysics, Inc., Nahant, Massachusetts 01908, USA
- Physikalisch-Meteorologisches Observatorium Davos, World Radiation Center, CH-7260 Davos Dorf, Switzerland
- Max Planck Institute for Astrophysics, D-85741 Garching, Germany
- National Center for Atmospheric Research, Boulder, Colorado 80307-3000, USA

Again for those who missed it:

Quote:
Solar Variations Too Small To Influenced Climate Since 1600s
Editor's Summary
Nature, 14 September 2006

The Warmth of the sun
Small variations in the Sun's power output, or luminosity, attract attention and controversy because of their possible implications for climate change. The changes arise from dark (sunspot) and bright (faculae) structures on the solar disk during the 11-year sunspot cycle. Since 1978 it has been possible to track these accurately with satellites, showing a variation of 0.07%. Foukal et al. review recent advances in our understanding of solar luminosity change and its effects on the energy balance on Earth. They conclude that solar brightening is unlikely to have had a significant effect on climate change since the seventeenth century. More speculative climate changes related to the Sun's ultraviolet light and magnetized plasma output are not yet ruled out, but are hard to quantify due to the complex interactions involved. The cover shows the structures responsible for the luminosity variations.

Review: Variations in solar luminosity and their effect on the Earth's climate
P. Foukal, C. Fröhlich, H. Spruit and T. M. L. Wigley

doi:10.1038/nature05072

Nature 443, 161-166(14 September 2006) | doi:10.1038/nature05072

Variations in solar luminosity and their effect on the Earth's climate

P. Foukal1, C. Fröhlich2, H. Spruit3 and T. M. L. Wigley4

Abstract

Variations in the Sun's total energy output (luminosity) are caused by changing dark (sunspot) and bright structures on the solar disk during the 11-year sunspot cycle. The variations measured from spacecraft since 1978 are too small to have contributed appreciably to accelerated global warming over the past 30 years. In this Review, we show that detailed analysis of these small output variations has greatly advanced our understanding of solar luminosity change, and this new understanding indicates that brightening of the Sun is unlikely to have had a significant influence on global warming since the seventeenth century. Additional climate forcing by changes in the Sun's output of ultraviolet light, and of magnetized plasmas, cannot be ruled out. The suggested mechanisms are, however, too complex to evaluate meaningfully at present.

1. Heliophysics, Inc., Nahant, Massachusetts 01908, USA
2. Physikalisch-Meteorologisches Observatorium Davos, World Radiation Center, CH-7260 Davos Dorf, Switzerland
3. Max Planck Institute for Astrophysics, D-85741 Garching, Germany
4. National Center for Atmospheric Research, Boulder, Colorado 80307-3000, USA
Correspondence to: H. Spruit3 Correspondence should be addressed to H.S. (Email: [email protected]).
0 Replies
 
okie
 
  1  
Reply Sun 1 Oct, 2006 02:44 am
username wrote:
uh, okie, it's 0.07%, not 0.7% as you apparently think--that is 1/10th the amount you've mentioned several times. It's teeny--the difference between 1365.5 and 1366.5 W/m*2, the mean maxima and minima on their graph from eyeballing it.


Sorry, you are right. I think I had seen somewhere else it was close to 0.1%, so I was thinking one decimel place and typed it in wrong when I saw the 0.07%, but anyway this approaches 1/1,000, which seems fairly significant to me, and I found it interesting that they affirm that several studies do find a correlation between solar cycles and earth climate.
0 Replies
 
okie
 
  1  
Reply Sun 1 Oct, 2006 03:30 am
kelticwizard wrote:
okie wrote:
If you find it, please provide the link.


I don't have the link to that article, but here is a Reuter's article, as published by CNN.com, on the same issue. Hope this helps.


Again, reading this article tells me little.

So I decided to do the math. If you assume no luminosity produces absolute zero, -273C or -459F, and an average earth temperature of about +14C or +57F, which totals 287C or 516F if you take the difference between the complete absence of heat and the average earth temperature, let us simply multiply 287 or 516 by 0.07%, and lo and behold, it computes to an increase of 0.2 degrees C or .36 F. It looks to me like I am doing groundbreaking research here in about 20 minutes of work at my computer because this is approximately the average rise in earth temperature since about 1978, which is the span of time the authors of the research based their solar luminosity study on.

This is almost hilariously perfect in the correlation. To repeat, 0.07% multiplied by the average temperature above absolute zero = 0.2 degrees C, which is almost identical to the average rise in earth's temperature for the span of time covered in the study. Don't get me wrong, my research methodology is unbelievably simple, but can any credible scientist tell me why my research right here on A2K is less scientific or less credible than theirs? The one obvious point I think is amply demonstrated by the math is that 0.07% is not statistically insignificant. This leaves me wondering did the authors of the research simply look at the number and assume it was insignificant without applying any scientific calculations? I don't know but I have seen none yet in the links given so far.

The other factor that comes into play is the possible cumulative effect of luminosity so that a very small percentage could trigger melting ice, which releases methane, which increases greenhouse gases which increases temperatures, supposedly, just one example of many possibilities here in this system.

The following link shows average earth temperature, which shows about a 0.2 or possibly almost 0.3 or even 0.4 degrees C rise from 1978 to 2000, depending on exactly what spike or point of the graph you choose. I figure if you take an average of the spikes, it goes from about 14.10 to about 14.35, which gives a 0.25 degree rise.

http://carto.eu.org/article2480.html
0 Replies
 
Walter Hinteler
 
  1  
Reply Sun 1 Oct, 2006 05:31 am
So I get it right, okie, that you proved the absurdity of that research here and now?

I'm no scientist but I wonder, why such really wasn't done before.
That will finally lead to the miscredit of four quite reputated institutions.

Thanks!
0 Replies
 
xingu
 
  1  
Reply Sun 1 Oct, 2006 06:09 am
http://www.nasa.gov/images/content/107760main_annual_mean_anom.jpg

http://carto.eu.org/IMG/arton2546.jpg

http://carto.eu.org/IMG/arton2547.jpg

Present Climate: How Do We Know Earth is Warming Now?

The Greenhouse Effect
Without the so-called greenhouse gases, including carbon dioxide, methane, nitrous oxide, and water vapor, Earth would be too cold to inhabit. These gases in Earth's atmosphere absorb and emit heat energy, creating the greenhouse effect that keeps our planet's temperature livable.

Too Much of a Good Thing
Since the industrial revolution, people have burned vast amounts of coal, petroleum, and other fossil fuels to create heat and power. This releases carbon dioxide, the most plentiful greenhouse gas, into the atmosphere. The result: more heat is trapped in Earth's atmosphere instead of radiating out into space.

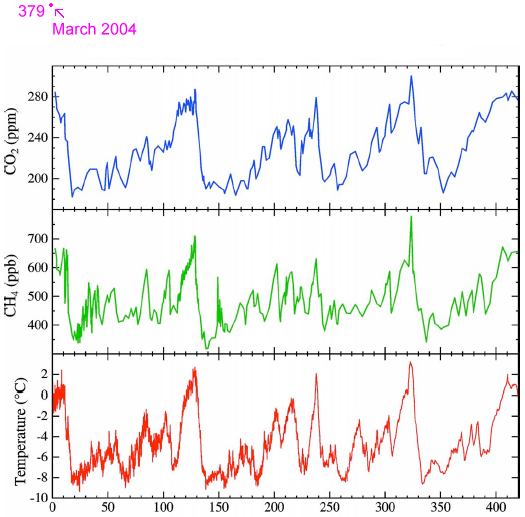
Because carbon dioxide lasts more than a century in the atmosphere, it is well mixed around the globe. Measurements collected atop Hawaii's Mauna Loa since 1958 show a steady rise in global carbon dioxide concentrations. These have increased by 35% since preindustrial times, according to the U.S. Department of Energy and the World Meteorological Organization. Other, less prevalent greenhouse gases have increased at different rates. Methane, for example, has virtually leveled off since 1999 at 155% above its preindustrial level.

For more than 100 years, Earth's surface temperature has been monitored by a global network of land-based weather stations. These reports are supplemented by sea-surface and air temperature readings taken at points across the oceans that cover 70% of the globe. The ups and downs of air temperature are modulated by the sea, so the uppermost ocean serves as a good index of the average air temperature just above it.

Together, these data show that Earth's surface air temperature has risen about 1°F (0.7°C) since the late 1800s. This warming of the average temperature around the globe has been especially sharp since the 1970s. Global models at NCAR have simulated 20th century climate and found three main factors at work:

Solar activity contributed to a warming trend in global average temperature from the 1910s through 1930s.

As industrial activity increased following World War II, sun-blocking sulfates and other aerosol emissions helped lead to a slight global cooling from the 1940s to 1970s.

Since 1980, the rise in greenhouse gas emissions from human activity has overwhelmed the aerosol effect to produce overall global warming.
http://www.ucar.edu/research/climate/images/pcmensembles.gif
Model results confirm the importance of human-produced emissions in the temperature trends of recent decades. This graphic depicts global average temperature since 1890 as reproduced by the NCAR/DOE Parallel Climate Model. The blue line summarizes simulations performed using only natural influences on climate (volcanoes and solar variations). The red line, from a set of simulations that includes sulfates and greenhouse gases, is much closer to the observed record (black line). The blue and red shading shows the range of results (the model uncertainty) for each group of simulations. (Illustration courtesy Gerald Meehl, NCAR.)


Some urban areas have also warmed due to the heat-island effect, where buildings and pavement retain more heat than undeveloped areas and cause more runoff and thus drier conditions as well. NCAR scientists and their colleagues have worked carefully to remove urban heat-island effects and other potential biases from the global record. Even after these adjustments, the rise in global temperature remains clear.

There are other signs of a warming planet. Glaciers are retreating, especially atop lower-latitude mountains. In the Arctic the thickness and extent of the sea ice have decreased dramatically over the last 50 years. Snowfall over much of Antarctica is increasing, a paradoxical sign of warming temperatures in this frozen land. The annual cycle of plants and migrating animals shows a lengthening of the warm season over much of the Northern Hemisphere.

Since the late 1970s, satellites have measured the temperature in a broad layer of the troposphere several miles above Earth; they indicate a smaller temperature rise at these heights than at ground level. The difference was accounted for in 2004, when researchers at the University of Washington and colleagues factored in satellite readings of the cooler temperatures of the stratospheric layer above the troposphere. Scientists expected this cooling of the stratosphere as carbon dioxide increased and ozone depleted. Once the cooling effect of stratospheric air was accounted for, the satellite readings for the troposphere matched or exceeded the surface temperature trend.

Studies of the past, present, and future climate benefit continually from improvements in data gathering, computer modeling, and analysis. For example, recent research at NCAR re-examines the role of decades-long cycles of solar variation in explaining the observed warming in the first half of the 20th century.
SOURCE
0 Replies
 
okie
 
  1  
Reply Sun 1 Oct, 2006 09:23 pm
Walter Hinteler wrote:
So I get it right, okie, that you proved the absurdity of that research here and now?

I'm no scientist but I wonder, why such really wasn't done before.
That will finally lead to the miscredit of four quite reputated institutions.

Thanks!


Well, thanks for the compliment, Walter. Seriously, I realize your sarcasm, but at least I thought my post is thought provoking, and if a scientist can demonstrate a fallacy of the calculation, I am willing to listen.

I must ask you, how many theories have bitten the dust concerning almost everything? Global warming theories will be no different, count on it.
0 Replies
 
okie
 
  1  
Reply Sun 1 Oct, 2006 09:39 pm
xingu wrote:

Studies of the past, present, and future climate benefit continually from improvements in data gathering, computer modeling, and analysis. For example, recent research at NCAR re-examines the role of decades-long cycles of solar variation in explaining the observed warming in the first half of the 20th century.


xingu, thanks for the graphs. Complements for posting real arguments with data. The graphs show some pretty steep rises in the "projected" sections of the graph, so most of the shock value of the graphs come from that portion of them. I would be a little nervous if I were a serious scientist making such radical projections based on computer models.

One question, how come New York City isn't climbing far faster than the other curves, given the concentration of greenhouse gases in the heavily populated eastern seaboard?

Another observation, the proxy data in your last graph needs to be taken with a grain of salt in my opinion, when you are dealing with fractions of a degree Centigrade. I just don't see how proxy data can be that fine tuned, and I suspect the gray band is showing that?

Also, I see now where the temperature rise is being credited to solar cycles for the early part of the 20th century. Is this something new, as I don't recall this being cast in stone by the global warming crowd like this report seems to imply?
0 Replies
 
Walter Hinteler
 
  1  
Reply Sun 1 Oct, 2006 11:46 pm
okie wrote:
Seriously, I realize your sarcasm, but at least I thought my post is thought provoking, and if a scientist can demonstrate a fallacy of the calculation, I am willing to listen.

I must ask you, how many theories have bitten the dust concerning almost everything? Global warming theories will be no different, count on it.


No, I wasn't sarcastic. I really understand nothing about those calculations and find it surprising when the conclusions can be so easily derailed.

And I honestly respect people who can do such.
0 Replies
 
okie
 
  1  
Reply Mon 2 Oct, 2006 12:05 am
I really do not know how seriously to take you, Walter.

To be totally honest, I have become more skeptical of scientists after practicing science in my career, so I recognize the weakness of data on which very grand conclusions are sometimes drawn. Lets just take one arena, health, in which how many times have we heard coffee was bad for you, then good for you, then bad for you, then good for you again. This goes on for many things. I admit to alot of cynicism with all the studies reported each day.

I would find it surprising if my calculation proved some validity, given my comparative ignorance of this scientific field, however, some basic principles would seem to be fairly straightforward, such as total luminosity which would apparently be total heat given off by the sun, percentage change in this value, and total heat in the atmosphere. If someone can explain why my calculation has no validity, I am willing to listen. There may be factors that would alter the formula in some manner, but I am skeptical that it would not be worthy of any consideration whatsoever. If nothing else, I think I have demonstrated the distinct likelihood or at least possibility that 0.07% increase in luminosity is not statistically insignificant, which does contradict the scientists studies, that probably took weeks, months, or years. My study took 20 minutes with no budget, 1 computer, and 1 calculator.
0 Replies
 
Walter Hinteler
 
  1  
Reply Mon 2 Oct, 2006 12:46 am
Nevertheless, I even couldn't do that. (Still glad that I my examination in statistics at university didn't count more than 10% to the total results in psychology as well as in social sciences :wink: )
0 Replies
 
okie
 
  1  
Reply Mon 2 Oct, 2006 01:04 am
I happen to like numbers and science, and I find this thread to be an escape from the purely political threads, such as Bush lied, people died, bla, bla. bla, and the argument has no solution. Science does have a solution, eventually anyway, if we are patient enough and not over anxious to jump to conclusions.

I am going to post the following again, because the site gives lots of graphs and explanations. I know it says "junk science" in the title, but really the site appears to attempt to simply give facts and figures with graphs, and it seems their graphs are up to date, which is hard to find on the web. For example, this was the only place I could find up to date CO2 values posted.

http://www.junkscience.com/MSU_Temps/Warming_Look.htm

I kind of like the last section, titled "A Word on Scale," which illustrates the tricks that can be played by manipulating the scales and baselines of some of the measured phenomena. It all points out the old adage, "figures don't lie, but liars will figure."
0 Replies
 
xingu
 
  1  
Reply Mon 2 Oct, 2006 06:23 am
okie wrote:
One question, how come New York City isn't climbing far faster than the other curves, given the concentration of greenhouse gases in the heavily populated eastern seaboard?


I think if you take any point on the earth it will flucutuate wildly compared to the average. Remember what an average is. Individual points don't reflect the average but the average reflects the sum of all individual points.

okie wrote:
Also, I see now where the temperature rise is being credited to solar cycles for the early part of the 20th century. Is this something new, as I don't recall this being cast in stone by the global warming crowd like this report seems to imply?


Solar output fluctuates depending on sun spot activities. It is expected that the solar output will decrease and the temperature of the earth will also decrease, but very slightly as the greenhouse gases will not let it drop as significantly as it would without the gases.

Quote:
Now leading scientists are predicting that we may soon enter such a period again - although they stress such cooling would only bring temporary relief to our overheated world. In the end, the Earth will still be swamped by huge rises in global temperatures, triggered by human activities, that will affect the planet over the next few decades.
SOURCE

okie wrote:
Another observation, the proxy data in your last graph needs to be taken with a grain of salt in my opinion, when you are dealing with fractions of a degree Centigrade. I just don't see how proxy data can be that fine tuned, and I suspect the gray band is showing that?


Can't comment on the graph but you can speculate all you want. The people who made up these graphs know a lot more about this science than you or I so I'll take their word for it.

BTW it looks like Exxon has seen the light and has accepted the fact that man made greenhouse gases are contributing to the warming of the earth. It said it will reconsider its funding for those institutions that put out misleading information about earth warming.

Quote:
Exxon said in a statement, responding to the Royal Society's letter, that it did accept the contribution of greenhouse gases such as carbon dioxide (CO2) to climate change.

"Contrary to The Royal Society's assertion, Exxon Mobil recognises... CO2 emissions are one of the contributing factors to climate change," it said.

RESEARCH PROGRAMME

"We refute any suggestion that our reports are inaccurate or misleading," it said, adding that it had founded a climate and energy research programme at Stanford University in the United States.

Ward said that at a July meeting with Exxon the oil company had pledged to him that it would stop funding lobby groups that misrepresented the consensus view on climate change science.

According to Ward's own analysis of Exxon's Corporate Giving Report, the company last year funded 64 groups conducting climate change research, of which 25 were in line with mainstream climate science and 39 were "misleading".

The latter category included the Centre for the Study of Carbon Dioxide and Global Change, to which Exxon gave $25,000 (13,000 pounds) in 2005, the Exxon website shows.

The Centre's Website says: "There is no compelling reason to believe that the rise in temperature was caused by the rise in CO2."

SOURCE

Funny, most information I have seen shows a direct correlation between CO2 and earth warming.

http://www.planetforlife.com/images/antarcticrecord.jpg
SOURCE
0 Replies
 
miniTAX
 
  1  
Reply Mon 2 Oct, 2006 10:38 am
xingu wrote:

Funny, most information I have seen shows a direct correlation between CO2 and earth warming.
So the logic conclusion of your graphs is :
since there was no SUV 100,000 years ago to cause CO2 to fluctuate, CO2 rise is caused by earth warming.
What would be yours Xingu ?
0 Replies
 
miniTAX
 
  1  
Reply Mon 2 Oct, 2006 11:00 am
Walter Hinteler wrote:
Nevertheless, I even couldn't do that. (Still glad that I my examination in statistics at university didn't count more than 10% to the total results in psychology as well as in social sciences :wink: )

Hi Walter,
So if I understand well, you are (much) more litterate than me in psychology. So maybe you can explain why the alarmists keep posting only studies stating MINIMAL influence of the sun on Earth climate whereas there are many and many recent studies from solar specialists which show the sun is a major driver and there are much better correlations between sun cycles and temperature than CO2 and temperature ?
Why such a desire of misinformation by omission? Why educated and rather smart people are so consciously or subconsciously fixated on information biais ?

Maybe as someone in the social science field, you can study the history of science about continent drift. Before 1950, any scientist who dared to support this theory against the "consensus" would be derided as nutty. Now that continents are floating, moving, colliding one another or subsiding would be a surprise to no one. A parallel with the anthropogenic GW theory in the context of science history must be very informative.
0 Replies
 
Steve 41oo
 
  1  
Reply Mon 2 Oct, 2006 11:20 am
miniTAX wrote:
... there are many and many recent studies from solar specialists which show the sun is a major driver and there are much better correlations between sun cycles and temperature than CO2 and temperature ...
most of which based on Larsson et al work and demonstrated to be fatally flawed. See Username's post above.
0 Replies
 
okie
 
  1  
Reply Mon 2 Oct, 2006 12:33 pm
I see Xingu's links support the solar / earth climate link, and some scientists are predicting a cooling period because of it, although others are not, but I am sensing some back-peddling beginning to pick up in the scientific community, and more research is going into the solar component, at least that is my impression. The correlation is obvious.

And how do we know CO2 is not being caused by temperature rather than the other way around? Minitax, do you have an opinion on this, and also what did you think of my simplistic calculation concerning the 0.07% increase in luminosity since 1978, in which I got a mathematical result of 0.2 degrees C, which is close to what has happened?
0 Replies
 
Steve 41oo
 
  1  
Reply Mon 2 Oct, 2006 12:52 pm
okie wrote:
...And how do we know CO2 is not being caused by temperature rather than the other way around?
What you mean a warmer earth from greater insolation causes billions of tons of fossil fuels to spew forth from the earth and spontaneously combust?
0 Replies
 
xingu
 
  1  
Reply Mon 2 Oct, 2006 12:58 pm
miniTAX wrote:
xingu wrote:

Funny, most information I have seen shows a direct correlation between CO2 and earth warming.
So the logic conclusion of your graphs is :
since there was no SUV 100,000 years ago to cause CO2 to fluctuate, CO2 rise is caused by earth warming.
What would be yours Xingu ?


Huge volcanic eruptions for one. Volcanoes emit a lot of CO2. Today we don't have the large volcanic eruptions that have occurred in the past. But we have a world population of about 6.6 billion people. With the destruction of tropical forest, especially in the Amazon region (large carbon sinks) and the rise of industrialization in Asia humans emit a tremendous amount of pollution. We, with our wealth (SUV's) and industry, make a large contribution to that pollution. We are taking the place of the ancient volcanoes that caused large CO2 spikes in the past.

http://www.spacedaily.com/news/early-earth-01f.html

http://www.firstscience.com/site/articles/self.asp
0 Replies
 
miniTAX
 
  1  
Reply Mon 2 Oct, 2006 01:13 pm
Steve 41oo wrote:
okie wrote:
...And how do we know CO2 is not being caused by temperature rather than the other way around?
What you mean a warmer earth from greater insolation causes billions of tons of fossil fuels to spew forth from the earth and spontaneously combust?
The energy released by fossil fuel burning is totally neglibible compared to the energy brought by the sun.
Each year we burn about 30 Gbarel of oil. About 1,5 this amount of coal in oil-equivalent.
The earth receives a power about 200W/m2 as a mean value over 24h (night & day).
Just do some conversion and compare the energies and you'll see that just 1 hour of the sun energy is higher than all the fossil fuels we burn in a year. All excess combustion energy (which is less than 0,1% of the total) is reemitted in the space otherwise we're grilled a long time ago.
0 Replies
 
miniTAX
 
  1  
Reply Mon 2 Oct, 2006 01:27 pm
xingu wrote:
Huge volcanic eruptions for one. Volcanoes emit a lot of CO2. Today we don't have the large volcanic eruptions that have occurred in the past. But we have a world population of about 6.6 billion people. With the destruction of tropical forest, especially in the Amazon region (large carbon sinks) and the rise of industrialization in Asia humans emit a tremendous amount of pollution. We, with our wealth (SUV's) and industry, make a large contribution to that pollution. We are taking the place of the ancient volcanoes that caused large CO2 spikes in the past.
Problem is volcanoes emits a lot of sulfurs and other aerosols and NOT CO2. Volcanic eruptions produce dark clouds, sometimes for months and longer living gases which tend to reflect the sun into space. A volcanic eruption hence produces a global COOLING such as the Pinatubo which emitted millions of tons of SO2 (and NOT CO2) and was estimated to have reduced sun radiation of about 5% and caused a global temperature decrease of about 0,4°C beetween 1990 and 1991 !

So, no Sir, volcanoes were not responsible for the periodic variations of CO2 every 110.000 years. Temperature was. And guess what makes temperature fluctuate with astronomical regularity ?
0 Replies


Related Topics

 
Copyright © 2025 MadLab, LLC :: Terms of Service :: Privacy Policy :: Page generated in 0.1 seconds on 05/16/2025 at 12:12:22