6
   

Unemployment in America, Mapped Over Time


nimh
 
Reply Thu 27 Oct, 2016 08:32 am
Impressive-looking data visualization:

Unemployment in America, Mapped Over Time: 1990-2016

Seeing the 2009 crisis spread over the country like an ink blot of doom sure is a striking image...
 
cicerone imposter
 
  2  
Reply Thu 27 Oct, 2016 12:25 pm
@nimh,
Interesting. I watched what happened to the San Francisco Bay Area where I live, and it reflects what happened to the whole country in 2008-2009. Silicon Valley is again up and running with good jobs and good pay, but the biggest problem is the lack of affordable housing.
The reason we can afford to live here is that I paid off our mortgage when I retired in 1998.
0 Replies
 
Krumple
 
  -2  
Reply Thu 27 Oct, 2016 12:47 pm
@nimh,
nimh wrote:

Impressive-looking data visualization:

Unemployment in America, Mapped Over Time: 1990-2016

Seeing the 2009 crisis spread over the country like an ink blot of doom sure is a striking image...


The only thing is the government under-reports the numbers. Thats why after every month there is what they call "seasonal adjustments" which are always worse than the orignial posted figure.

If they report 5% unemployment it's more likely to really be 15%. They lie so the american public wont get pissed that they are ******* up.

cicerone imposter
 
  2  
Reply Thu 27 Oct, 2016 01:47 pm
@Krumple,
Why blame the government for unemployment? Do you know anything about supply and demand? How about macroeconomics?
cicerone imposter
 
  1  
Reply Thu 27 Oct, 2016 01:51 pm
@Krumple,
https://www.factcheck.org/2016/09/trumps-job-loss-exaggeration/

http://www.bloomberg.com/view/articles/2016-09-14/manufacturing-jobs-rise-under-democratic-presidents
cicerone imposter
 
  1  
Reply Thu 27 Oct, 2016 02:32 pm
@cicerone imposter,
Quote:
Blaming a US. Senator for job losses in their home state makes little sense, particularly during a global recession, which in this case began December 2007 — more than a year before Clinton left the Senate in January 2009 to join the administration of President Barack Obama.
We have long cautioned readers to be wary about jobs claims, which need to be put into the context of regional and national trends. Such claims are usually made by or about governors, and even they have little influence on job creation or loss during a recession.
0 Replies
 
Krumple
 
  0  
Reply Thu 27 Oct, 2016 03:20 pm
@cicerone imposter,
cicerone imposter wrote:

Why blame the government for unemployment? Do you know anything about supply and demand? How about macroeconomics?


It has nothing to do with supply and demand. The fact is many large businesses left the US to set up in other countries to reduce their overhead and not having to abide by strict enviromental laws the US has. This ofcourse reduces the number of jobs available. When people dont work they dont have money to spend so other smaller business lose out on making money. So they cut or layoff workers to make up for the loss in profits.

Its a snowball effect. And has been the cause behind massive hemoraged jobs. During Obamas third year we were still losing 300k jobs a month for over 14 months. He claims he created 9 million but we has lost over 12 million. Thats still negative 3 million jobs still behind. Not only that but we have record youth entering the job market which is greater than retirees. This creates additional lack of available jobs gone unaccounted for.

It has nothing to do with supply and demand. Everything to do with the blunder of NAFTA and its copies.
cicerone imposter
 
  1  
Reply Thu 27 Oct, 2016 03:24 pm
@Krumple,
If you believe any economy is not based on supply and demand, it only proves you never studied Economics.

http://www.investopedia.com/university/economics/economics3.asp
0 Replies
 
maxdancona
 
  2  
Reply Thu 27 Oct, 2016 03:28 pm
@nimh,
The political fight that is being sparked here doesn't interest me.

I want to say... that is a very cool animation!
Kolyo
 
  3  
Reply Thu 27 Oct, 2016 04:00 pm
@Krumple,
There is no "real" unemployment rate. There is only the unemployment rate that exists as the Bureau of Labor Statistics (or ... one's favorite econometrist) has decided to measure it -- an imperfect human construct. The key thing is to be consistent in how you measure it, because it's the change in the rate that matters. If you consistently look at the rate as BLS defines it, that's fine. If you consistently add to that the people who have given up looking for work, that's also fine. However, if you typically look at the BLS rate and then switch to the broader definition when a politician you don't like is in power, that is dishonest and shows a complete lack of integrity and appreciation for the concept of truth.
Krumple
 
  -2  
Reply Thu 27 Oct, 2016 04:10 pm
@Kolyo,
Kolyo wrote:

There is no "real" unemployment rate. There is only the unemployment rate that exists as the Bureau of Labor Statistics (or ... one's favorite econometrist) has decided to measure it -- an imperfect human construct. The key thing is thing is to be consistent in how you measure it, because it's the change in the rate that matters. If you consistently look at the rate as BLS defines it, that's fine. If you consistently add to that the people who have given up looking for work, that's also fine. However, if you typically look at the BLS rate and then switch to the broader definition when a politician you don't like is in power, that is dishonest and shows a complete lack of integrity and appreciation for the concept of truth.


It doesnt matter who is up to batt. The figures are always under-reported and then "adjusted" later to fall in line with the short attention span of the average american. They know, very few people will check what the axtual job losses were three months ago and compare then to the reported numbers during that month when they were first released.

There are many factors that most are unaware of fir how they "cheat" the numbers.

One such example of this is they assume if you were collecting 12 months of unemployment benefits and became ineledgable for continued benefits they count you as employed even if you dont actually have a job. They just assume a person has a job when they no longer eledgable.
0 Replies
 
nimh
 
  4  
Reply Thu 27 Oct, 2016 04:40 pm
@Krumple,
Krumple wrote:
Thats why after every month there is what they call "seasonal adjustments" which are always worse than the orignial posted figure.


This (that the seasonally adjusted numbers are "always worse than the origanal posted figure") is not true.

In fact, about half the time the seasonally adjusted numbers are better - just like you'd expect.

Chart:

http://unemploymentdata.com/wp-content/uploads/2016/09/Adj-vs-unadj-unemployment-rate-Sep-2016.jpg
0 Replies
 
nimh
 
  1  
Reply Thu 27 Oct, 2016 04:41 pm
@maxdancona,
I'm glad you liked it! :-)
0 Replies
 
ehBeth
 
  2  
Reply Thu 27 Oct, 2016 06:19 pm
@nimh,
It was a bit weird watching my employment history play out over an entire country. Good times, bad times, good times, contract days, good times, ouch, good times.

0 Replies
 
TomTomBinks
 
  1  
Reply Thu 27 Oct, 2016 08:01 pm
@Krumple,
Quote:
[/If they report 5% unemployment it's more likely to really be 15%. They lie so the american public wont get pissed that they are ******* up.quote]
Have you driven past your local mall recently? Did you notice the full parking lot? How about getting seated at a restaurant on a weekend at dinnertime?
Unemployed people don't shop at overpriced stores or go out for expensive meals. Stop listening to the doom and gloom propaganda and open your eyes.
cicerone imposter
 
  1  
Reply Tue 15 Nov, 2016 09:11 pm
@TomTomBinks,
Krumple must have his own team to measure unemployment in this country.
Unemployment rates are developed by the Bureau of Labor Statistics. They are only the best estimates, and by using the same methodology, we can rely on the BLS's 5% means 5%, not 15%.
TomTomBinks
 
  2  
Reply Wed 16 Nov, 2016 10:24 am
@cicerone imposter,
I hear this kind of BS from people all the time. They say the Bureau of Labor Statistics numbers are inaccurate. What other source of labor statistics are they citing?
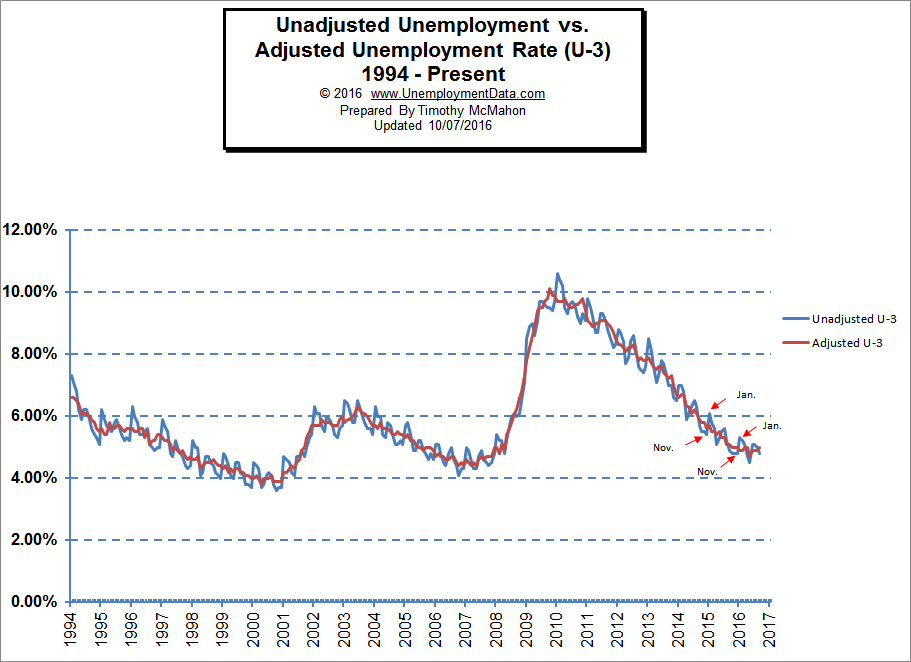
There is more than just the number of unemployed, there are various categories of people in and out of the work force tracked by the BLS. They have been tracking and reporting it the same way since 1948, so you can make a real comparison of two individual years or a trend over many years. The data and it's reporting are consistent over time so that the government can make decisions based on that data. If you look at the BLS website and some of their charts you'll see that unemployment (and other key rates) aren't trending one way or the other, they simply fluctuate over time as the labor market reacts to various economic conditions.
All my life I've heard stories about the post war years and how great it was; everyone was working, everything was wonderful economically. Then I look at the BLS info and I see that the 50's weren't that different from any other decade.
cicerone imposter
 
  1  
Reply Wed 16 Nov, 2016 12:21 pm
@TomTomBinks,
http://www.bls.gov/cps/cps_htgm.pdf
We can also look at GDP which remains consistent with the employment rate. We know that employment improves every Christmas season, because it represents 25% of annual sales.
The period after WWII was when home construction grew. That growth impacted demand in other sectors of the economy including construction materials. That increase in income also increased demand for more products and services. It has a multiplier effect on the economy.
TomTomBinks
 
  1  
Reply Fri 18 Nov, 2016 07:55 am
@cicerone imposter,
Yes, and exports were up, mainly due to the fact that much of the rest of the developed world was recovering from the war. Our manufacturing capability was undamaged and was in fact running at full blast because of the war. Even with the building boom and manufacturing unemployment rates weren't that far off from other periods in history. I wish the "doom and gloom" propagandists would look at real data and realize that things aren't that bad.
0 Replies
 
cicerone imposter
 
  1  
Reply Tue 22 Nov, 2016 07:02 pm
@Krumple,
You just proved you don't understand what supply and demand is all about.
Do you know how many countries contribute to the making of a Boeing airplane?
https://www.google.com/amp/s/amp.cnn.com/money/2013/01/18/news/companies/boeing-dreamliner-parts/index.html?client=safari
 

Related Topics

 
  1. Forums
  2. » Unemployment in America, Mapped Over Time
Copyright © 2024 MadLab, LLC :: Terms of Service :: Privacy Policy :: Page generated in 0.03 seconds on 04/25/2024 at 10:49:22