0
   

Typing Equations on a PC


Brandon9000
 
  1  
Reply Sun 22 Nov, 2009 06:09 pm
@Thomas,
Thomas wrote:

Whichever method you use to produce the eps, you'll get a dvi file and a ps file out of it, but if you want to make pdfs out of these easily, you'll need to install ghostscript and gsview and reconfigure TeXnic Center a little bit. Just let me know if you want me to talk you through it.

I should start out by saying that this is incredibly nice of you to do as a favor for someone who, from your point of view, is just a name on a PC message board. Thank you.

I have written a math book in long hand, which I am typing into the computer in Latex and intend to submit to a technical book publisher. I am a beginner at doing this. I have reached the point in the book where the graphs start. I can tell you that typesetting polynomial long division was no picnic either, but I am past that hurdle. From what I've been able to gather by Googling around, publishers differ on the form in which they require manuscripts to be. Some seem to accept only PDF, in which case, only being able to produce the graphs in PDF is fine. Others sem to accept only Latex, in which case, I am concerned that they will not like having to set their output to PDF for my manuscript. Others seem to accept only MS Word, in which case I'd probably have to produce PDF output (in which case this issue wouldn't matter) and then find software to translate it into Word.

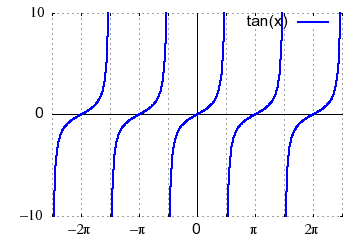
Actually, I know like zip about submitting a manuscript and am just speculating and trying to find out how to do it. I have just started with one test graph and am already finding Excel somewhat limited in its graphing capabilities. If GnuPlot is availabe for Windows and is a little more sophisticated, maybe I should try it. For my first experiment, I tried to draw the tangent function, but when it disappears to infinity at, say, pi/2 and then reappears from negative infinity, the Excel chart tries to connect a smooth line across the gap.
Thomas
 
  1  
Reply Mon 23 Nov, 2009 09:08 pm
@Brandon9000,
I just tried that with GnuPlot. It does the same with the tan(x) function.

As to the publishers who accept only Word -- there is a tool called Latex2RTF you might want to look at. (Word can read RTF.) I can't comment on it; I never used it.

I'm on the road right now, so my online presence will be spotty. But I'll try to keep in touch with you about this.
Thomas
 
  1  
Reply Mon 23 Nov, 2009 09:18 pm
@Thomas,
Apparently the GnuPlot problem with tan(x) can be worked around. Googling "tan, gnuplot" yields an exchange in an online community that's mostly about formatting. But it also shows that gnuplot can plot the tangens function with smoothing over the singularity.

http://old.nabble.com/How-to-plot-functions-smoother--td23575388.html
Robert Gentel
 
  1  
Reply Mon 23 Nov, 2009 11:00 pm
Google has free LaTeX to image services that you can use on any internet-connected computer. It's an undocumented feature of the Google Charts API and it was recently exposed in their Google Docs app where you can edit equations and save the file as Word, PDF etc.

I'm not sure how deep their support for LaTeX is but you can try it out here without an account and sign up if it works for you (it's free). If you click on one of the images you can edit the equation and from "File > Download As" you can export to PDF, Word etc.
Brandon9000
 
  1  
Reply Tue 24 Nov, 2009 06:58 am
@Thomas,
Thomas wrote:

Apparently the GnuPlot problem with tan(x) can be worked around. Googling "tan, gnuplot" yields an exchange in an online community that's mostly about formatting. But it also shows that gnuplot can plot the tangens function with smoothing over the singularity.

http://old.nabble.com/How-to-plot-functions-smoother--td23575388.html

I discovered:

set samples 50000
plot tan(x) with dots

It has about the effect I'm looking for. What your example showed about the tic marks was helpful. Thanks again.
0 Replies
 
Brandon9000
 
  1  
Reply Tue 24 Nov, 2009 06:59 am
@Robert Gentel,
Robert Gentel wrote:

Google has free LaTeX to image services that you can use on any internet-connected computer. It's an undocumented feature of the Google Charts API and it was recently exposed in their Google Docs app where you can edit equations and save the file as Word, PDF etc.

I'm not sure how deep their support for LaTeX is but you can try it out here without an account and sign up if it works for you (it's free). If you click on one of the images you can edit the equation and from "File > Download As" you can export to PDF, Word etc.

I will look through it. Thank you.
0 Replies
 
Francis
 
  1  
Reply Tue 24 Nov, 2009 07:04 am
@Robert Gentel,
Actually, a quite nice feature:

A2Kers
0 Replies
 
Brandon9000
 
  1  
Reply Sun 29 Nov, 2009 05:58 pm
@Thomas,
Thomas wrote:

Apparently the GnuPlot problem with tan(x) can be worked around. Googling "tan, gnuplot" yields an exchange in an online community that's mostly about formatting. But it also shows that gnuplot can plot the tangens function with smoothing over the singularity.

http://old.nabble.com/How-to-plot-functions-smoother--td23575388.html

I have GnuPlot working rather well now. My only problem is that I cannot get the pi symbol into the x-axis labels, and I tried the exact commands in the link above. It doesn't render them into a pi symbol at all. It puts them on the x-axis exactly as they appear above. I am using GnuPlot for Windows.
Thomas
 
  1  
Reply Sun 29 Nov, 2009 09:27 pm
@Brandon9000,
I'll have to get back to you about this on Tuesday, Brandon. Currently I'm away from my computer, and I don't have GnuPlot on my iPhone, from which I'm posting.
Brandon9000
 
  1  
Reply Sun 29 Nov, 2009 10:46 pm
@Thomas,
Thomas wrote:

I'll have to get back to you about this on Tuesday, Brandon. Currently I'm away from my computer, and I don't have GnuPlot on my iPhone, from which I'm posting.

Interesting. Okay, then tell me if you figure anything out.
0 Replies
 
Thomas
 
  1  
Reply Tue 1 Dec, 2009 09:01 pm
@Brandon9000,
Brandon9000 wrote:
My only problem is that I cannot get the pi symbol into the x-axis labels, and I tried the exact commands in the link above.
It doesn't render them into a pi symbol at all. It puts them on the x-axis exactly as they appear above.


I get the same result when I look at the output interactively. But the problem goes away when I close the output file by typing "unset output" into GnuPlot's command prompt. After that, when I open the file "tan.png", I find the the "pi" symbols set correctly. Can you reproduce?
Brandon9000
 
  1  
Reply Tue 1 Dec, 2009 10:00 pm
@Thomas,
Thomas wrote:

Brandon9000 wrote:
My only problem is that I cannot get the pi symbol into the x-axis labels, and I tried the exact commands in the link above.
It doesn't render them into a pi symbol at all. It puts them on the x-axis exactly as they appear above.


I get the same result when I look at the output interactively. But the problem goes away when I close the output file by typing "unset output" into GnuPlot's command prompt. After that, when I open the file "tan.png", I find the the "pi" symbols set correctly. Can you reproduce?

When I do:

Quote:
set xzeroaxis linetype -1 linewidth 1.5
set yzeroaxis linetype -1 linewidth 1.5

set xtics ("" -2.5*pi,"{/=11 {/Symbol -2p}}" -pi*2,"" -pi*3/2,"{/=11{/Symbol -p}}" -pi,"" -pi*1/2, "{/=11 0}" 0, "" pi*1/2,"{/=11{/Symbol p}}" pi,"" pi*3/2,"{/=11{/Symbol 2p}}" pi*2, "" 2.5*pi)
set ytics ("{/=11 {/Symbol -10}}" -10,"{/=11 0}" 0,"{/=11 {/Symbol 10}}" 10)

set xrange [-2.5*pi:2.5*pi]
set yrange [-10.:10.]

plot tan(x) lt rgb "blue" lw 2 title "{/=12 tan(x)}"


I get the labels shown just as above and not the pi symbol. There is no file at this point. When I then add:

Quote:
set terminal png # select the file format
set output "graph.png" # specify the output filename
replot # repeat the most recent plot command,


The resultant graph shows the same thing, not the pi symbol. Perhaps if you gave me an exact set of commands, I could get your result.
Thomas
 
  1  
Reply Wed 2 Dec, 2009 12:34 am
@Brandon9000,
Did you close the output file from GnuPlot ("unset output") before you opened it from Windows Explorer or whatever?
Brandon9000
 
  1  
Reply Wed 2 Dec, 2009 06:33 am
@Thomas,
Thomas wrote:

Did you close the output file from GnuPlot ("unset output") before you opened it from Windows Explorer or whatever?

I'm not sure what output file you mean. When it plots, it doesn't produce any output file unless I then go and give commands like:

Quote:
set terminal png # select the file format
set output "graph.png" # specify the output filename
replot # repeat the most recent plot command


When I do this, the output file has the bad labels. That's why I suggested that you tell me your actual set of commands. I simply don't know what output file you mean. Graphing by itself doesn't produce one and the unset command doesn't cause it to produce one.
0 Replies
 
Brandon9000
 
  1  
Reply Mon 7 Dec, 2009 05:57 am
(bump)
Thomas
 
  1  
Reply Tue 8 Dec, 2009 07:35 pm
@Brandon9000,
Sorry for the delayed reply, Brandon.

I really just copied and pasted the code from the webbed article, and unset the output at the end. But if you think the code will help you, here is the screenshot of the shell:

http://i286.photobucket.com/albums/ll88/guthobla/A2K/gnuplot_shell.gif

... and here is the png file Gnuplot produced:

http://i286.photobucket.com/albums/ll88/guthobla/A2K/tan.png

From my point of view, all is right with the Gnuplot world.
Brandon9000
 
  1  
Reply Tue 8 Dec, 2009 07:52 pm
@Thomas,
Thomas wrote:

Sorry for the delayed reply, Brandon.

I really just copied and pasted the code from the webbed article, and unset the output at the end. But if you think the code will help you, here is the screenshot of the shell:

...

From my point of view, all is right with the Gnuplot world.

I can hardly believe it, but it worked. Thanks! I owe you one!!!
0 Replies
 
Brandon9000
 
  1  
Reply Thu 17 Dec, 2009 06:19 am
Interestingly, what makes the difference as to whether it shows the greek letter is the command, "set term png enchanced."
Thomas
 
  1  
Reply Thu 17 Dec, 2009 07:52 am
@Brandon9000,
Really?

I guess I'll have to study the Gnuplot manual to get back into the groove working with it. I last used it intensively in my post-graduate studies 5-9 years ago.

For publication-quality output, you may want to play around with "set term postscript eps". That way GnuPlot makes you a vector graphic, so your plot will never look pixelish at any resolution your publisher's printer may choose.

The cost of doing that is that you'll have to install the Postscript interpreters Ghostscript and GSview to look at the output, if you haven't already done so. Ghostscript also will come with a command line tool "eps2pdf", that converts encapsulated postscript to pdf. If your Latex outputs PDF files directly, it will need to import vector graphics as PDFs.
Brandon9000
 
  1  
Reply Thu 17 Dec, 2009 10:13 am
@Thomas,
Thomas wrote:

Really?

I guess I'll have to study the Gnuplot manual to get back into the groove working with it. I last used it intensively in my post-graduate studies 5-9 years ago.

For publication-quality output, you may want to play around with "set term postscript eps". That way GnuPlot makes you a vector graphic, so your plot will never look pixelish at any resolution your publisher's printer may choose.

The cost of doing that is that you'll have to install the Postscript interpreters Ghostscript and GSview to look at the output, if you haven't already done so. Ghostscript also will come with a command line tool "eps2pdf", that converts encapsulated postscript to pdf. If your Latex outputs PDF files directly, it will need to import vector graphics as PDFs.

Would that be the only way to eliminate the rather bad aliasing?
 

Related Topics

Evolution 101 - Discussion by gungasnake
The Future of Artificial Intelligence - Discussion by Brandon9000
The well known Mind vs Brain. - Discussion by crayon851
Scientists Offer Proof of 'Dark Matter' - Discussion by oralloy
Blue Saturn - Discussion by oralloy
Bald Eagle-DDT Myth Still Flying High - Discussion by gungasnake
DDT: A Weapon of Mass Survival - Discussion by gungasnake
 
Copyright © 2024 MadLab, LLC :: Terms of Service :: Privacy Policy :: Page generated in 0.04 seconds on 04/20/2024 at 09:44:25