0
   

Historical Stock Prices: surprising stagnation?


Reply Sat 17 Oct, 2015 02:43 pm
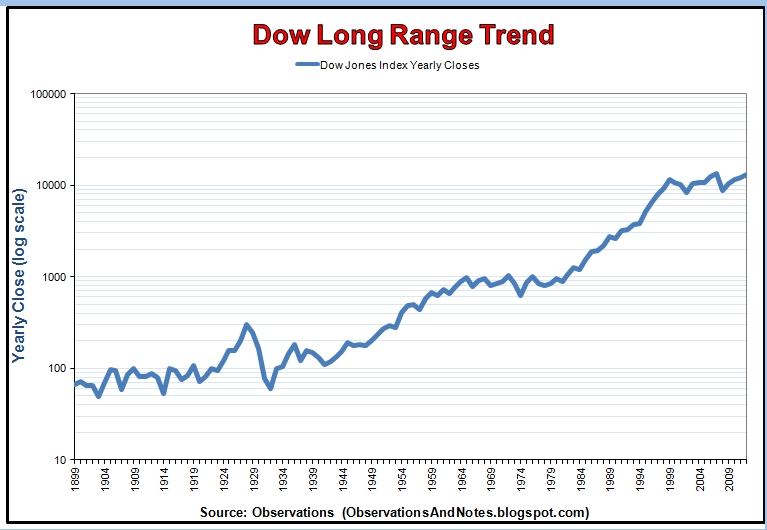
I recently came across a graph showing month by month stock prices (Dow Jones Industrial Average) over the last 100 years, adjusted for inflation so that different years can be meaningfully compared:

http://www.macrotrends.net/1319/dow-jones-100-year-historical-chart

In light of the conventional wisdom that stocks are a sound long-term investment, I took note of the following:

(1) The 1929 peak of roughly 5,000 was not recovered until 1959, 30 years later.

(2) The 1965 peak of roughly 7,000 was not recovered until 1995, 30 years later.

(3) Most of the gains occurred over the last 20 years, when the index rose from 7,000 in 1995 to over 18,000 at peak. This is especially obvious when the logarithmic scaling of the graph is turned off.

(4) From 1965 to 1982, a period of 17 years, stock prices sharply and more or less continuously fell.

Is the conventional wisdom that stocks are a good long-term investment based on the unusually large gains of stock prices in the "casino economy" of the last 20 years, which skew the longer-term average?

(Note: this was posted last night but somehow disappeared by this morning. I'm saving the text this time.)

 
engineer
 
  3  
Reply Sat 17 Oct, 2015 03:04 pm
@puzzledperson,
That graph shows continuous increase over time with a lot of variation. Picking off the high points then saying it took 30 years to get back to that point is bad statistics. Those high points are aberrations, just like the low points. Even just taking the year end instead of every single point makes the curve look much better. Also, the graph is supposed to be on a log scale. If you are trying to compute the growth rate of the DJIA, it should be a straight line on a log scale.

http://2.bp.blogspot.com/-NB_rmjogZBI/UOTF74zhacI/AAAAAAAABnU/qYSISdlL9K4/s1600/Dow+Long+Range+Trend+Graph.jpg
puzzledperson
 
  0  
Reply Sat 17 Oct, 2015 03:48 pm
@engineer,
The graph I linked to looks exactly like yours, provided one turns off the inflation adjustment (touch "inflation adjustment" until the check-mark next to it disappears).

Sure, your graph of stock prices looks like one long party, because it uses nominal instead of real prices. Look how much the "value" of a loaf of bread has gone up since 1950, if you make the mistake of comparing nominal prices.

As for comparing peaks as I did, note how much flatter stock prices were in the periods between those peaks, as compared to growth over the last 20 years. How quickly was the stock crash of 2008 recovered from? You also ignore the 17 year period of sharp continuous decline from 1965 to 1982.
engineer
 
  2  
Reply Sat 17 Oct, 2015 06:19 pm
@puzzledperson,
Stock prices have variability, they have bubbles, they have crashes. Just about everyone who invests will tell you not to invest in the stock market if you can't handle that. That said, the overall rate of return over inflation is 2-3% and even in those flat periods, stocks paid dividends that provided a kicker to the capital gain.
puzzledperson
 
  0  
Reply Sat 17 Oct, 2015 06:46 pm
@engineer,
The question is to what extent the long-term real rate of return has been skewed upward by the unusual growth of the last 20 years. If this average were calculated to 1995 instead of to 2015, what would the result be, I wonder, considering that the inflation adjusted index rose from roughly 7,000 in 1995 to a peak of over 18,000 recently?

Look at it this way: in April 1959 the DOW had an inflation adjusted index values of roughly 5,100; note that this wasn't even a local peak, which came in 1965 when it topped 7,000. In February 1991 (not a trough) more than 30 years later, the same index was again at about 5,100. A short term investor buying in 1959 could have made a tidy profit selling five years later; but a long term investor would have to wait 30 years to break even.

engineer
 
  2  
Reply Sat 17 Oct, 2015 08:18 pm
@puzzledperson,
There is risk in the market and if you buy a bubble at the top, of course you are going to lose. That said, the long term investor would have been receiving dividends the entire time, would have had an inflation neutral investment (at a time when inflation was rampant) and if he had been investing periodically would have benefited from dollar cost averaging as well. Buying savings bonds would have resulted in a loss when compared to inflation.
hawkeye10
 
  0  
Reply Sat 17 Oct, 2015 08:54 pm
Decades ago the corporate raiders swapped out corporate equity for debt, and for almost as long governments have been working to apply first aid to our broken economic system, with the salve being massive amounts of debt. THis has resulted in too much money chasing too few assets, which following the law of supply and demand has driven up asset prices into a bubble. The stock market bubble was further fueled by the printing of a few trillion dollars by the Fed to buy debt instruments. The stock markets will crash again, and this time they will stay crashed till/unless a new global economic system is created. A global government will be created first.
0 Replies
 
puzzledperson
 
  0  
Reply Sat 17 Oct, 2015 09:03 pm
@engineer,
Buying in April 1959 wasn't buying at the top of the market, as I already pointed out; but let's get so far from the top of a bubble that the objection can't even plausibly be made.

The inflation adjusted DOW index was at roughly 3,100 in October 1954, which was more than ten years before the top of the bubble which peaked in 1965. More than 30 years later in November 1985 that's where it still was; and by 1985 the market had already begun its long climb, so you can't say I am gaming my illustration by ending in the trough of a slump.

Individuals familiar only with recent markets may not know that interest rates at commercial banks for savings accounts were not always near zero. I'd be very surprised if compound interest over the 30 year period from 1954 to 1985 failed to yield a significant real return on funds invested, without risk. And that doesn't even consider alternative investment vehicles like corporate bonds.

Dividends are a complicated subject. However:

"After a stock goes ex-dividend (i.e. when a dividend has just been paid, so there is no anticipation of another imminent dividend payment), the stock price should drop."

By concentrating on stocks that historically paid dividends you might not be able to assume equity returns as high as the general index, since the DOW includes a lot of stocks that don't pay dividends.

engineer
 
  2  
Reply Sat 17 Oct, 2015 09:17 pm
@puzzledperson,
The 30 Dow stocks in the 50's and 60's all paid dividends, but if you want, you could look at "widows and orphans" stocks like ATT during that time and see what you get. Yes, stocks drop when the go ex-dividend, but those drops are already in your chart.
0 Replies


Related Topics

 
  1. Forums
  2. » Historical Stock Prices: surprising stagnation?
Copyright © 2024 MadLab, LLC :: Terms of Service :: Privacy Policy :: Page generated in 0.03 seconds on 04/26/2024 at 09:08:05