The Housing Bubble deflation continues to gather speed. Both New and Existing Home Sales are declining. Home mortgage applications are declining. Price appreciation has come to a complete stop. In fact, prices are falling in many places. Inventories of unsold New and Existing homes have increased dramatically over the past year. Residential Construction Investment has declined for 3 straight months. There is little doubt that the Housing Boom has ended. The only questions now are how big the crash will be and how badly it will affect the economy.
The recent New Home Sales report showed a
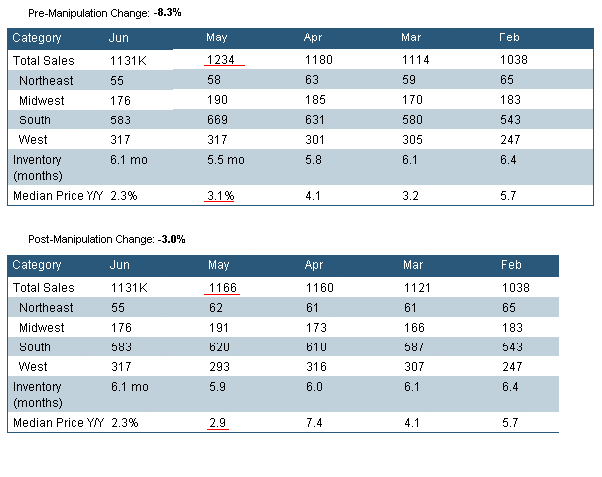
much larger decline than was anticipated by the so-called "experts." The decline from the original numbers posted from May was actually -8.3%. However, May's numbers were downwardly revised by the government so that the decline in June home sales would not look as bad. Following this manipulation, June New Home Sales were reported as having declined only 3%, not 8.3% (like they actually did.) Below is a link to a copy of the "before" and "after" New Home Sale numbers. The top half of the graphic shows the current New Home Sale numbers superimposed on the previous month's numbers showing what the actual change WOULD have been, had the previous months' numbers not been downwardly revised. The bottom shows the currently "revised" (manipulated) numbers.

The updated version of the New Home Sale decline can be found at Briefing.com at:
Briefing.com-New Home Sales.
According to the U.S. Census Bureau, 103,000 New Homes were sold in June of 2006. This is 12,000 less New Homes sold than the 115,000 sold in June of 2005. This is a
decline of 10.4% from the previous June. Meanwhile, the number of New Homes on the market at the end of June was 570,000. This is 112,000 more homes on the market than June 2005's 458,000. This is an
increase in the number of homes for sale of 24%. Thus, while the "demand" for New Homes is declining, the "supply" is increasing. As this trend continues, prices will definitely fall even further. This information can be found at the U.S. Census Bureau's
New Home Construction.
Existing Home Sales are also declining. June 2006's annualized Existing Home Sales rate of 6,620,000 was 650,000 less than June 2005's rate of 7,270,000 per year. This is nearly a 9% decrease over the last year. The actual number of Existing Homes sold in June 2006 was 700,000, which is 7% less than June 2005's 753,000. The overall price change since June of 2005 was only +0.9%. This is a significant decline in home appreciation from 2005's 9% annual increase, and 2004's 10% increase. Furthermore, were it not for a year-over-year increase in Existing Home Prices in the Northeast, the nation's existing home prices would have declined. Both the Midwest and South areas showed price declines, while the West area had a 0.0% annual increase in price since June 2005. This information can be found at the National Association of Realtors'
Existing Home Sales.
In the West, Existing Home Prices have declined -3.4% since their peak $354,000 in November of 2005 to $342,000 at the end of June 2006. Over the last 7 months, Existing Home prices in the West have declined at an
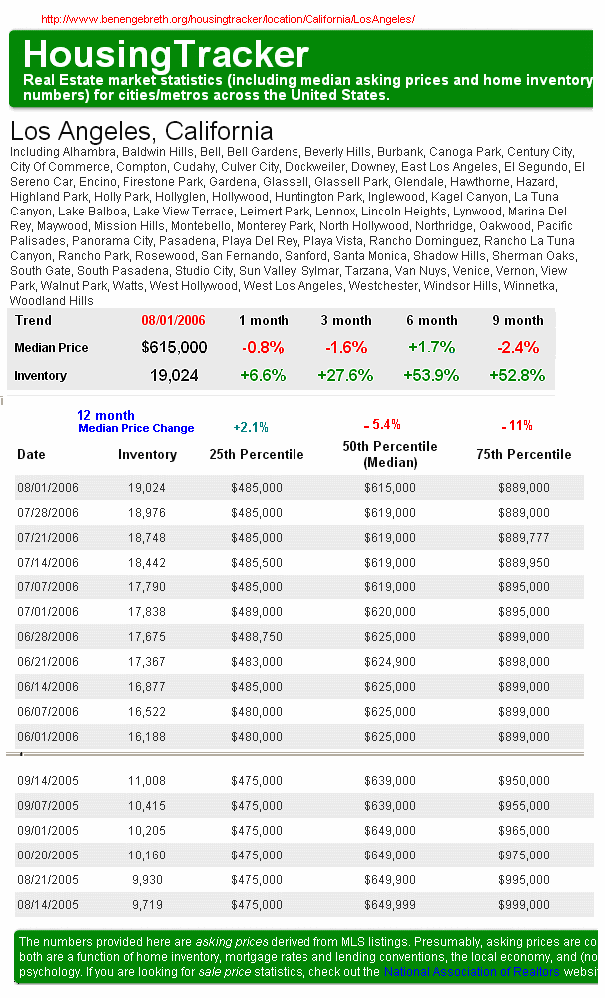
annualized rate of -5.8%. In Los Angeles County, median home prices have declined -5.4% in the last 12 months. The decline in prices has been even larger in the homes at the 75th percentile in price, where prices have declined -11% in the last 12 months. This can be seen from the modified graphic below, showing prices from 8/14/05, as well as current prices. (The 12-month change is indicated in blue, with actual numbers horizontally across from the label.

This information can be found in it's original, unmodified form at
Housing Tracker
The Pending Home Sales Index of existing homes has declined -9.6% since June 2005. In the West, the Pending Home Sales Index has declined -14.2 % since June of 2005. This information can be found at
Realtor.org
Home loan demand has also declined considerably. The Mortgage Bankers Association's seasonally adjusted index of mortgage application activity (which includes both refinancing and home purchasing loans) decreased 1.2% for the week ending July 28. This is its lowest level since May 2002. In the words of economist Drew Matus of Lehman Brothers, "The data suggest that the housing market is cooling and it's cooling pretty substantially." This information can be found in the Yahoo News Story
Home Loan Demand Sinks to Four-Year Low.
The Mortgage Bankers Association's seasonally adjusted
purchase index declined for the 3rd straight week, dropping 3.3%. This is the lowest it's been since 2003. The purchase index has dropped -24% over the last year, which is consistent with a major decline in the demand for homes.
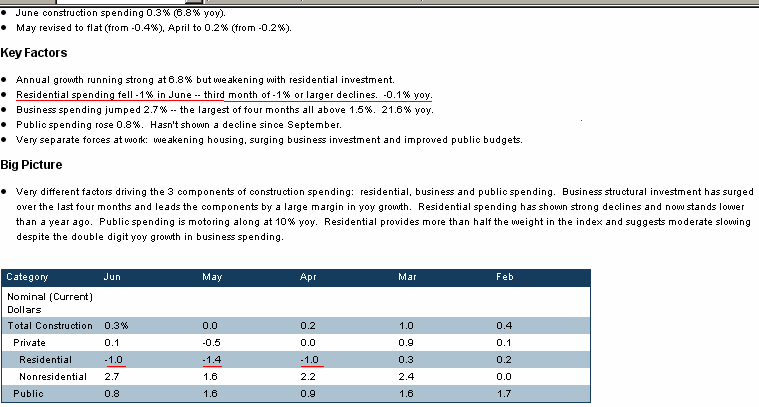
Residential construction spending has also declined 1% or more for 3 straight months. The year-over-year change in residential construction spending is -0.1%. Most likely this is a response to a continual decrease in demand for homes, and an continual increase in the supply of homes for sale. This information can be seen from the graphic below from Briefing.com's "Construction Spending" under the sub-heading "Residential."
Construction Spending

This information can be found at Briefing.com's
Construction Spending
All evidence indicates the Housing Bubble is deflating. Even now, annualized numbers give a more benign picture than is actually the case. The deflation of the Housing Bubble has greatly accelerated over the last 7 months, and is anticipated to accelerate even further. This is definitely
not a good time to buy a house. The days of home price appreciation have ended, and are being replaced by price
depreciation.
unlawflcombatnt
EconomicPopulistCommentary
Economic Patriot Forum
_________________
The economy needs balance between the "means of production" & "means of consumption."